29
/de/
de
AIzaSyAYiBZKx7MnpbEhh9jyipgxe19OcubqV5w
April 1, 2024
62337
World
WLD
false
2
1
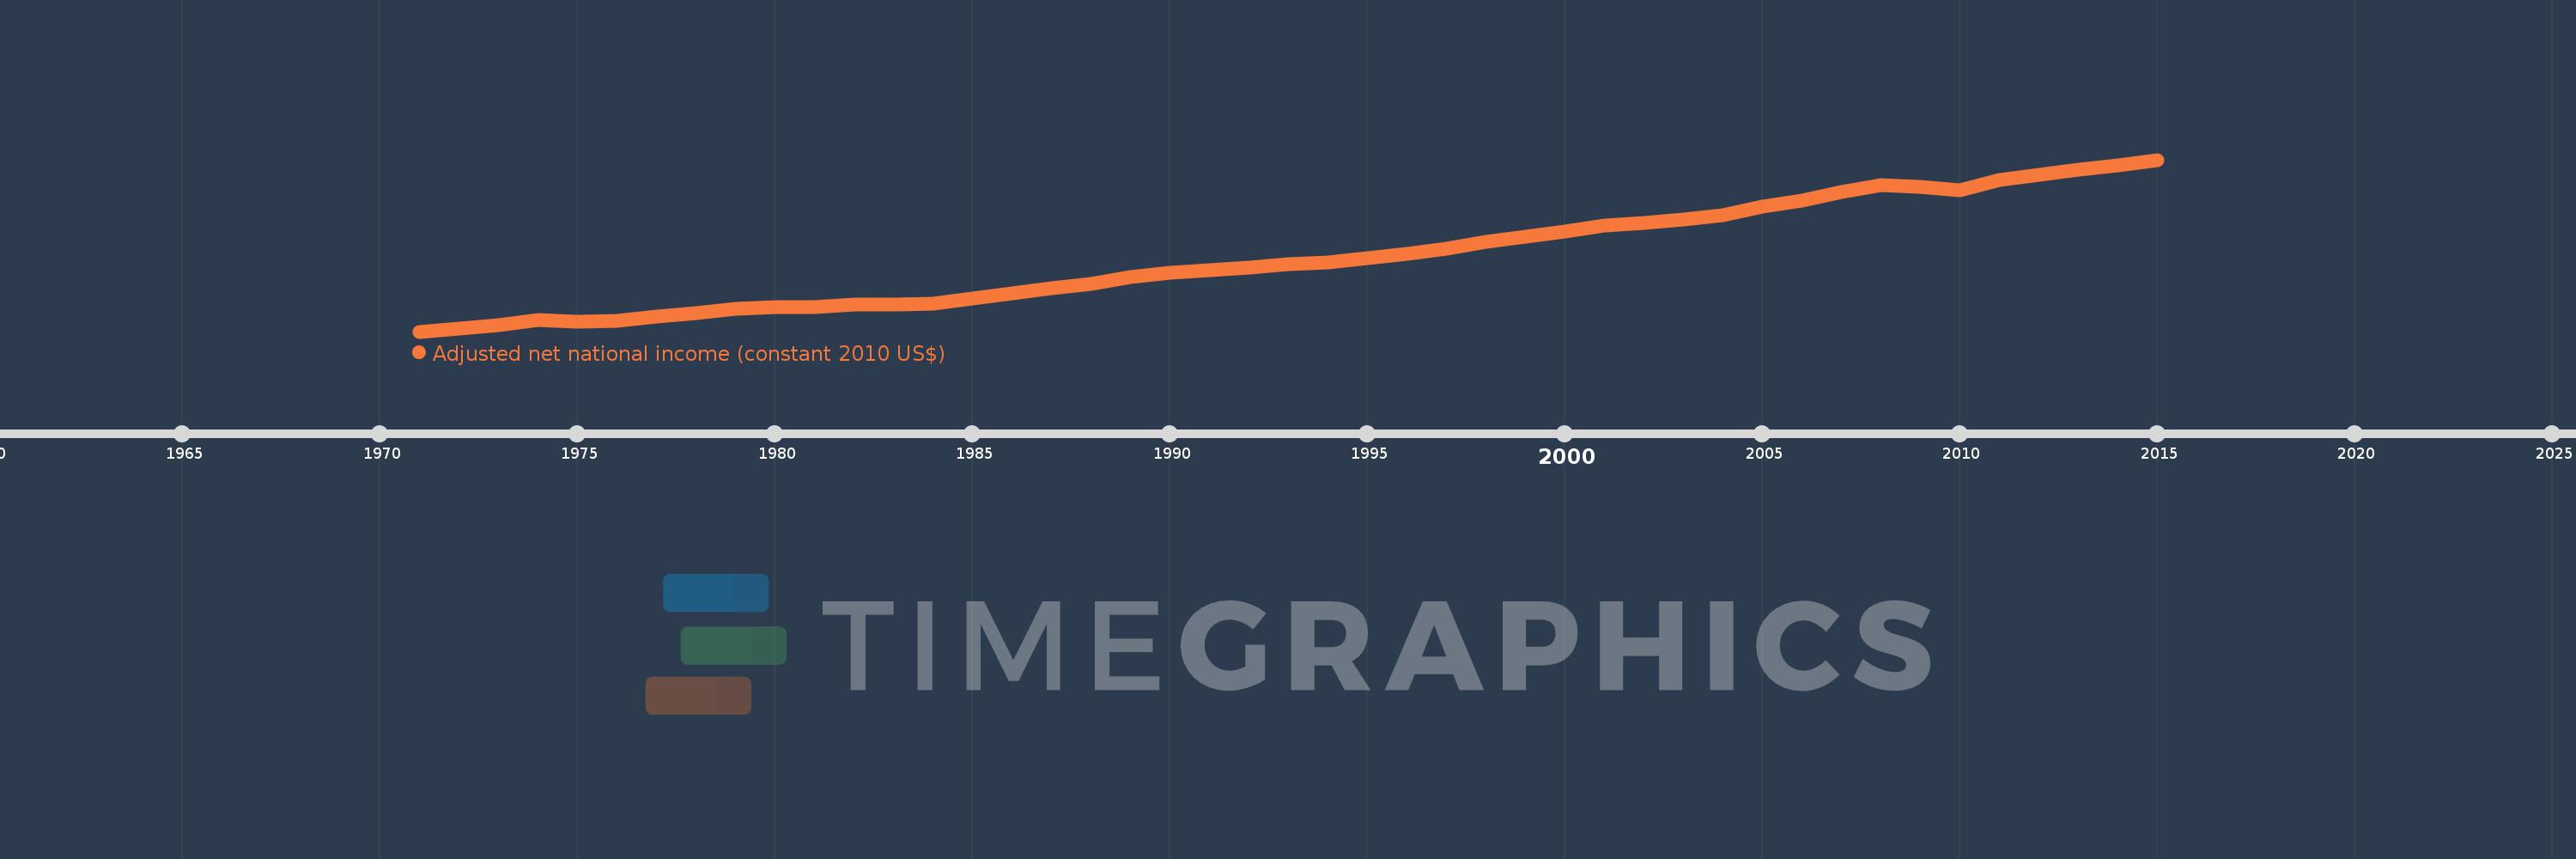
Adjusted net national income (constant 2010 US$)
2015,2014,2013,2012,2011,2010,2009,2008,2007,2006,2005,2004,2003,2002,2001,2000,1999,1998,1997,1996,1995,1994,1993,1992,1991,1990,1989,1988,1987,1986,1985,1984,1983,1982,1981,1980,1979,1978,1977,1976,1975,1974,1973,1972,1971
Diese Statistik in anderen Ländern:
AfghanistanAlbaniaAlgeriaAngolaArab WorldArgentinaArmeniaAustraliaAustriaAzerbaijanBahamas, TheBahrainBangladeshBarbadosBelarusBelgiumBelizeBeninBhutanBoliviaBotswanaBrazilBulgariaBurkina FasoBurundiCabo VerdeCambodiaCameroonCanadaCaribbean small statesCentral African RepublicCentral Europe and the BalticsChadChileChinaColombiaComorosCongo, Dem. Rep.Congo, Rep.Costa RicaCote d'IvoireCroatiaCubaCyprusCzech RepublicDenmarkDominicaDominican RepublicEarly-demographic dividendEast Asia & PacificEast Asia & Pacific (excluding high income)East Asia & Pacific (IDA & IBRD countries)EcuadorEgypt, Arab Rep.El SalvadorEritreaEstoniaEthiopiaEuro areaEurope & Central AsiaEurope & Central Asia (excluding high income)Europe & Central Asia (IDA & IBRD countries)European UnionFijiFinlandFragile and conflict affected situationsFranceGabonGambia, TheGeorgiaGermanyGhanaGreeceGuatemalaGuineaGuinea-BissauGuyanaHaitiHeavily indebted poor countries (HIPC)High incomeHondurasHungaryIBRD onlyIDA & IBRD totalIDA blendIDA onlyIDA totalIndiaIndonesiaIran, Islamic Rep.IraqIrelandIsraelItalyJamaicaJapanJordanKazakhstanKenyaKiribatiKorea, Rep.KuwaitKyrgyz RepublicLao PDRLate-demographic dividendLatin America & Caribbean Latin America & Caribbean (excluding high income)Latin America & the Caribbean (IDA & IBRD countries)LatviaLeast developed countries: UN classificationLebanonLesothoLiberiaLibyaLithuaniaLow & middle incomeLow incomeLower middle incomeLuxembourgMacedonia, FYRMadagascarMalawiMalaysiaMaldivesMaliMauritaniaMauritiusMexicoMiddle East & North AfricaMiddle East & North Africa (excluding high income)Middle East & North Africa (IDA & IBRD countries)Middle incomeMoldovaMongoliaMoroccoMozambiqueNamibiaNepalNetherlandsNew ZealandNicaraguaNigerNigeriaNorth AmericaNorwayOECD membersOmanOther small statesPacific island small statesPakistanPanamaPapua New GuineaParaguayPeruPhilippinesPolandPortugalPost-demographic dividendPre-demographic dividendQatarRomaniaRussian FederationRwandaSamoaSao Tome and PrincipeSaudi ArabiaSenegalSeychellesSierra LeoneSingaporeSlovak RepublicSloveniaSmall statesSolomon IslandsSouth AfricaSouth AsiaSouth Asia (IDA & IBRD)SpainSri LankaSt. LuciaSt. Vincent and the GrenadinesSub-Saharan Africa Sub-Saharan Africa (excluding high income)Sub-Saharan Africa (IDA & IBRD countries)SurinameSwazilandSwedenSwitzerlandTajikistanTanzaniaThailandTogoTongaTrinidad and TobagoTunisiaTurkeyTurkmenistanUgandaUkraineUnited Arab EmiratesUnited KingdomUnited StatesUpper middle incomeUruguayUzbekistanVanuatuVenezuela, RBVietnamWorldYemen, Rep.ZambiaZimbabwe Zeitlinie:
Diese Zeitleiste vorliegt die Graphik ab 1971 J. bis 2015 J. World. Die Angaben bis 1970 J. sind nicht vorhanden. Die Zahl aktueller Beobachtungen nach Daten: 45.
Die Quelle (Bezeichnung):
Kennzahlen der Weltentwicklung
Die Quelle (Einrichtung):
World Bank staff estimates based on sources and methods in World Bank's "The Changing Wealth of Nations: Measuring Sustainable Development in the New Millennium" (2011).
Kategorien:
Economy & Growth
Es wurde aktualisiert:
23 Apr 2017 Jahr
Kennzahlen der Wertänderungen vom Jahr zum Jahr
im Durchschnitt:
36.13 Trln
Minimum:
18.629 Trln
1 Jan 1971 Jahr
Maximum:
58.867 Trln
1 Jan 2015 Jahr
Zum Datum der Beobachtung
Wert
Absolute Veränderung
Die Veränderung bezüglich dem vorherigen Wert
1 Jan 1971 Jahr
18.629 Trln
+18.629 Trln
0.0%
1 Jan 1972 Jahr
19.295 Trln
+666.808 Mlrd.
3.58%
1 Jan 1973 Jahr
20.175 Trln
+879.296 Mlrd.
4.56%
1 Jan 1974 Jahr
21.344 Trln
+1.17 Trln
5.8%
1 Jan 1975 Jahr
20.963 Trln
-380.866 Mlrd.
-1.78%
1 Jan 1976 Jahr
21.085 Trln
+121.789 Mlrd.
0.58%
1 Jan 1977 Jahr
22.052 Trln
+966.951 Mlrd.
4.59%
1 Jan 1978 Jahr
22.894 Trln
+842.29 Mlrd.
3.82%
1 Jan 1979 Jahr
23.975 Trln
+1.08 Trln
4.72%
1 Jan 1980 Jahr
24.318 Trln
+342.939 Mlrd.
1.43%
1 Jan 1981 Jahr
24.393 Trln
+75.558 Mlrd.
0.31%
1 Jan 1982 Jahr
24.88 Trln
+487.199 Mlrd.
2.0%
1 Jan 1983 Jahr
24.93 Trln
+49.524 Mlrd.
0.2%
1 Jan 1984 Jahr
25.072 Trln
+141.744 Mlrd.
0.57%
1 Jan 1985 Jahr
26.472 Trln
+1.401 Trln
5.59%
1 Jan 1986 Jahr
27.512 Trln
+1.039 Trln
3.93%
1 Jan 1987 Jahr
28.708 Trln
+1.197 Trln
4.35%
1 Jan 1988 Jahr
29.759 Trln
+1.051 Trln
3.66%
1 Jan 1989 Jahr
31.315 Trln
+1.556 Trln
5.23%
1 Jan 1990 Jahr
32.445 Trln
+1.13 Trln
3.61%
1 Jan 1991 Jahr
33.067 Trln
+622.535 Mlrd.
1.92%
1 Jan 1992 Jahr
33.611 Trln
+543.466 Mlrd.
1.64%
1 Jan 1993 Jahr
34.414 Trln
+803.105 Mlrd.
2.39%
1 Jan 1994 Jahr
34.758 Trln
+344.16 Mlrd.
1.0%
1 Jan 1995 Jahr
35.849 Trln
+1.091 Trln
3.14%
1 Jan 1996 Jahr
36.824 Trln
+975.254 Mlrd.
2.72%
1 Jan 1997 Jahr
38.085 Trln
+1.261 Trln
3.42%
1 Jan 1998 Jahr
39.633 Trln
+1.548 Trln
4.07%
1 Jan 1999 Jahr
40.781 Trln
+1.148 Trln
2.9%
1 Jan 2000 Jahr
41.976 Trln
+1.194 Trln
2.93%
1 Jan 2001 Jahr
43.381 Trln
+1.405 Trln
3.35%
1 Jan 2002 Jahr
44.105 Trln
+723.839 Mlrd.
1.67%
1 Jan 2003 Jahr
44.904 Trln
+799.907 Mlrd.
1.81%
1 Jan 2004 Jahr
45.97 Trln
+1.065 Trln
2.37%
1 Jan 2005 Jahr
47.912 Trln
+1.943 Trln
4.23%
1 Jan 2006 Jahr
49.238 Trln
+1.326 Trln
2.77%
1 Jan 2007 Jahr
51.295 Trln
+2.057 Trln
4.18%
1 Jan 2008 Jahr
52.982 Trln
+1.687 Trln
3.29%
1 Jan 2009 Jahr
52.567 Trln
-415.016 Mlrd.
-0.78%
1 Jan 2010 Jahr
51.759 Trln
-807.645 Mlrd.
-1.54%
1 Jan 2011 Jahr
54.205 Trln
+2.446 Trln
4.73%
1 Jan 2012 Jahr
55.333 Trln
+1.128 Trln
2.08%
1 Jan 2013 Jahr
56.551 Trln
+1.218 Trln
2.2%
1 Jan 2014 Jahr
57.545 Trln
+993.569 Mlrd.
1.76%
1 Jan 2015 Jahr
58.867 Trln
+1.322 Trln
2.3%
Bewertung der Länder gemäß mit laufender Statistik nach Jahren


Kommentare: