29
/de/
de
AIzaSyAYiBZKx7MnpbEhh9jyipgxe19OcubqV5w
April 1, 2024
133791
France
FRA
true
2
1
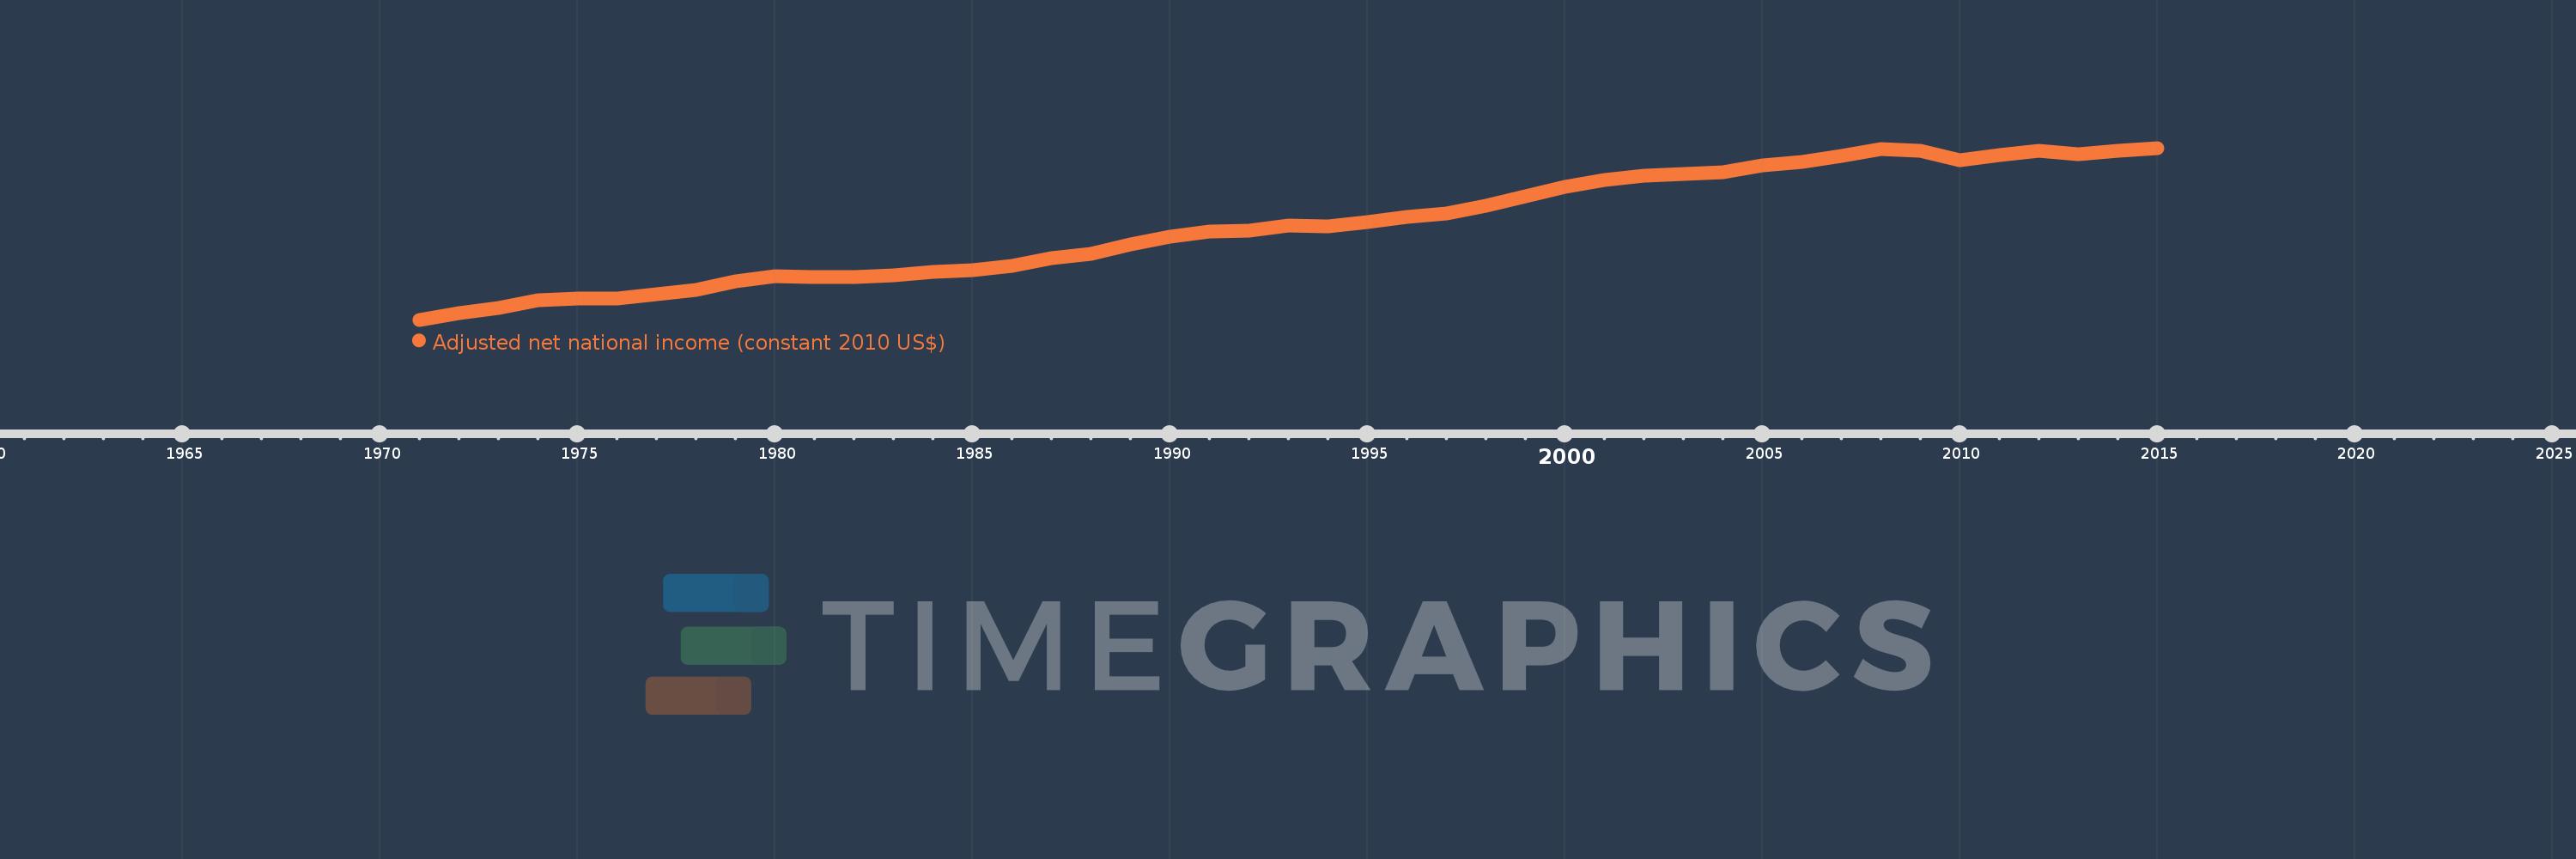
Adjusted net national income (constant 2010 US$)
2015,2014,2013,2012,2011,2010,2009,2008,2007,2006,2005,2004,2003,2002,2001,2000,1999,1998,1997,1996,1995,1994,1993,1992,1991,1990,1989,1988,1987,1986,1985,1984,1983,1982,1981,1980,1979,1978,1977,1976,1975,1974,1973,1972,1971
Diese Statistik in anderen Ländern:
AfghanistanAlbaniaAlgeriaAngolaArab WorldArgentinaArmeniaAustraliaAustriaAzerbaijanBahamas, TheBahrainBangladeshBarbadosBelarusBelgiumBelizeBeninBhutanBoliviaBotswanaBrazilBulgariaBurkina FasoBurundiCabo VerdeCambodiaCameroonCanadaCaribbean small statesCentral African RepublicCentral Europe and the BalticsChadChileChinaColombiaComorosCongo, Dem. Rep.Congo, Rep.Costa RicaCote d'IvoireCroatiaCubaCyprusCzech RepublicDenmarkDominicaDominican RepublicEarly-demographic dividendEast Asia & PacificEast Asia & Pacific (excluding high income)East Asia & Pacific (IDA & IBRD countries)EcuadorEgypt, Arab Rep.El SalvadorEritreaEstoniaEthiopiaEuro areaEurope & Central AsiaEurope & Central Asia (excluding high income)Europe & Central Asia (IDA & IBRD countries)European UnionFijiFinlandFragile and conflict affected situationsFranceGabonGambia, TheGeorgiaGermanyGhanaGreeceGuatemalaGuineaGuinea-BissauGuyanaHaitiHeavily indebted poor countries (HIPC)High incomeHondurasHungaryIBRD onlyIDA & IBRD totalIDA blendIDA onlyIDA totalIndiaIndonesiaIran, Islamic Rep.IraqIrelandIsraelItalyJamaicaJapanJordanKazakhstanKenyaKiribatiKorea, Rep.KuwaitKyrgyz RepublicLao PDRLate-demographic dividendLatin America & Caribbean Latin America & Caribbean (excluding high income)Latin America & the Caribbean (IDA & IBRD countries)LatviaLeast developed countries: UN classificationLebanonLesothoLiberiaLibyaLithuaniaLow & middle incomeLow incomeLower middle incomeLuxembourgMacedonia, FYRMadagascarMalawiMalaysiaMaldivesMaliMauritaniaMauritiusMexicoMiddle East & North AfricaMiddle East & North Africa (excluding high income)Middle East & North Africa (IDA & IBRD countries)Middle incomeMoldovaMongoliaMoroccoMozambiqueNamibiaNepalNetherlandsNew ZealandNicaraguaNigerNigeriaNorth AmericaNorwayOECD membersOmanOther small statesPacific island small statesPakistanPanamaPapua New GuineaParaguayPeruPhilippinesPolandPortugalPost-demographic dividendPre-demographic dividendQatarRomaniaRussian FederationRwandaSamoaSao Tome and PrincipeSaudi ArabiaSenegalSeychellesSierra LeoneSingaporeSlovak RepublicSloveniaSmall statesSolomon IslandsSouth AfricaSouth AsiaSouth Asia (IDA & IBRD)SpainSri LankaSt. LuciaSt. Vincent and the GrenadinesSub-Saharan Africa Sub-Saharan Africa (excluding high income)Sub-Saharan Africa (IDA & IBRD countries)SurinameSwazilandSwedenSwitzerlandTajikistanTanzaniaThailandTogoTongaTrinidad and TobagoTunisiaTurkeyTurkmenistanUgandaUkraineUnited Arab EmiratesUnited KingdomUnited StatesUpper middle incomeUruguayUzbekistanVanuatuVenezuela, RBVietnamWorldYemen, Rep.ZambiaZimbabwe Zeitlinie:
Diese Zeitleiste vorliegt die Graphik ab 1971 J. bis 2015 J. France. Die Angaben bis 1970 J. sind nicht vorhanden. Die Zahl aktueller Beobachtungen nach Daten: 45.
Die Quelle (Bezeichnung):
Kennzahlen der Weltentwicklung
Die Quelle (Einrichtung):
World Bank staff estimates based on sources and methods in World Bank's "The Changing Wealth of Nations: Measuring Sustainable Development in the New Millennium" (2011).
Kategorien:
Economy & Growth
Es wurde aktualisiert:
23 Apr 2017 Jahr
Kennzahlen der Wertänderungen vom Jahr zum Jahr
im Durchschnitt:
1.671 Trln
Minimum:
932.306 Mlrd.
1 Jan 1971 Jahr
Maximum:
2.286 Trln
1 Jan 2015 Jahr
Zum Datum der Beobachtung
Wert
Absolute Veränderung
Die Veränderung bezüglich dem vorherigen Wert
1 Jan 1971 Jahr
932.306 Mlrd.
+932.306 Mlrd.
0.0%
1 Jan 1972 Jahr
982.246 Mlrd.
+49.94 Mlrd.
5.36%
1 Jan 1973 Jahr
1.025 Trln
+43.067 Mlrd.
4.38%
1 Jan 1974 Jahr
1.089 Trln
+63.376 Mlrd.
6.18%
1 Jan 1975 Jahr
1.1 Trln
+11.097 Mlrd.
1.02%
1 Jan 1976 Jahr
1.098 Trln
-2.248 Mlrd.
-0.2%
1 Jan 1977 Jahr
1.133 Trln
+35.9 Mlrd.
3.27%
1 Jan 1978 Jahr
1.169 Trln
+35.584 Mlrd.
3.14%
1 Jan 1979 Jahr
1.236 Trln
+66.711 Mlrd.
5.71%
1 Jan 1980 Jahr
1.275 Trln
+39.062 Mlrd.
3.16%
1 Jan 1981 Jahr
1.268 Trln
-6.389 Mlrd.
-0.5%
1 Jan 1982 Jahr
1.266 Trln
-2.694 Mlrd.
-0.21%
1 Jan 1983 Jahr
1.285 Trln
+19.142 Mlrd.
1.51%
1 Jan 1984 Jahr
1.308 Trln
+23.161 Mlrd.
1.8%
1 Jan 1985 Jahr
1.325 Trln
+16.813 Mlrd.
1.29%
1 Jan 1986 Jahr
1.354 Trln
+29.073 Mlrd.
2.19%
1 Jan 1987 Jahr
1.417 Trln
+62.796 Mlrd.
4.64%
1 Jan 1988 Jahr
1.452 Trln
+35.665 Mlrd.
2.52%
1 Jan 1989 Jahr
1.528 Trln
+75.936 Mlrd.
5.23%
1 Jan 1990 Jahr
1.587 Trln
+58.821 Mlrd.
3.85%
1 Jan 1991 Jahr
1.631 Trln
+43.388 Mlrd.
2.73%
1 Jan 1992 Jahr
1.635 Trln
+4.962 Mlrd.
0.3%
1 Jan 1993 Jahr
1.672 Trln
+36.109 Mlrd.
2.21%
1 Jan 1994 Jahr
1.667 Trln
-4.742 Mlrd.
-0.28%
1 Jan 1995 Jahr
1.704 Trln
+36.743 Mlrd.
2.2%
1 Jan 1996 Jahr
1.741 Trln
+37.131 Mlrd.
2.18%
1 Jan 1997 Jahr
1.773 Trln
+31.796 Mlrd.
1.83%
1 Jan 1998 Jahr
1.827 Trln
+54.797 Mlrd.
3.09%
1 Jan 1999 Jahr
1.902 Trln
+75.192 Mlrd.
4.11%
1 Jan 2000 Jahr
1.982 Trln
+79.033 Mlrd.
4.15%
1 Jan 2001 Jahr
2.036 Trln
+54.44 Mlrd.
2.75%
1 Jan 2002 Jahr
2.07 Trln
+34.262 Mlrd.
1.68%
1 Jan 2003 Jahr
2.078 Trln
+7.913 Mlrd.
0.38%
1 Jan 2004 Jahr
2.095 Trln
+16.969 Mlrd.
0.82%
1 Jan 2005 Jahr
2.152 Trln
+56.671 Mlrd.
2.7%
1 Jan 2006 Jahr
2.179 Trln
+27.24 Mlrd.
1.27%
1 Jan 2007 Jahr
2.221 Trln
+41.529 Mlrd.
1.91%
1 Jan 2008 Jahr
2.279 Trln
+58.285 Mlrd.
2.62%
1 Jan 2009 Jahr
2.264 Trln
-14.591 Mlrd.
-0.64%
1 Jan 2010 Jahr
2.187 Trln
-77.409 Mlrd.
-3.42%
1 Jan 2011 Jahr
2.231 Trln
+44.654 Mlrd.
2.04%
1 Jan 2012 Jahr
2.265 Trln
+33.618 Mlrd.
1.51%
1 Jan 2013 Jahr
2.238 Trln
-27.469 Mlrd.
-1.21%
1 Jan 2014 Jahr
2.264 Trln
+25.985 Mlrd.
1.16%
1 Jan 2015 Jahr
2.286 Trln
+22.549 Mlrd.
1.0%
Bewertung der Länder gemäß mit laufender Statistik nach Jahren


Kommentare: