29
/de/
de
AIzaSyAYiBZKx7MnpbEhh9jyipgxe19OcubqV5w
April 1, 2024
42055
Latin America & Caribbean (excluding high income)
LAC
false
2
1
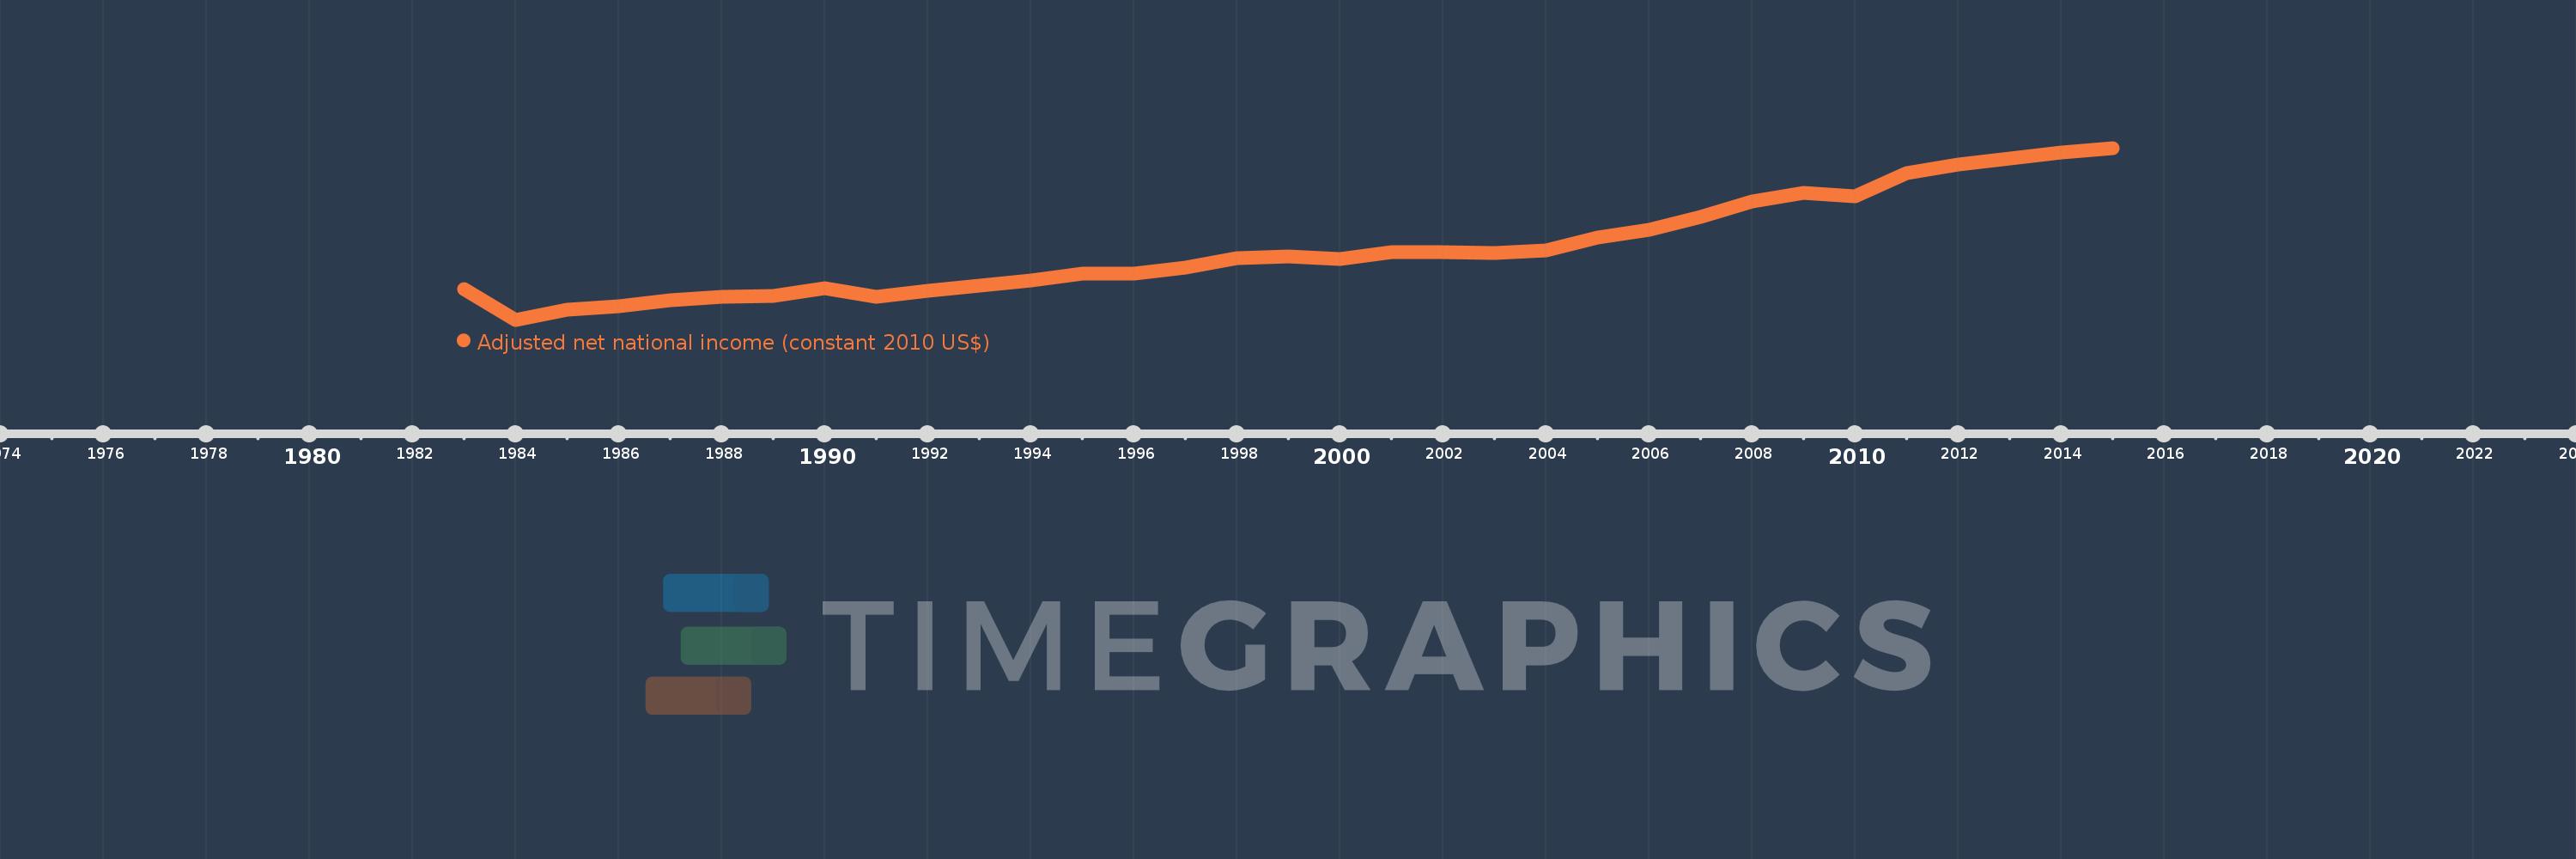
Adjusted net national income (constant 2010 US$)
2015,2014,2013,2012,2011,2010,2009,2008,2007,2006,2005,2004,2003,2002,2001,2000,1999,1998,1997,1996,1995,1994,1993,1992,1991,1990,1989,1988,1987,1986,1985,1984,1983
Diese Statistik in anderen Ländern:
AfghanistanAlbaniaAlgeriaAngolaArab WorldArgentinaArmeniaAustraliaAustriaAzerbaijanBahamas, TheBahrainBangladeshBarbadosBelarusBelgiumBelizeBeninBhutanBoliviaBotswanaBrazilBulgariaBurkina FasoBurundiCabo VerdeCambodiaCameroonCanadaCaribbean small statesCentral African RepublicCentral Europe and the BalticsChadChileChinaColombiaComorosCongo, Dem. Rep.Congo, Rep.Costa RicaCote d'IvoireCroatiaCubaCyprusCzech RepublicDenmarkDominicaDominican RepublicEarly-demographic dividendEast Asia & PacificEast Asia & Pacific (excluding high income)East Asia & Pacific (IDA & IBRD countries)EcuadorEgypt, Arab Rep.El SalvadorEritreaEstoniaEthiopiaEuro areaEurope & Central AsiaEurope & Central Asia (excluding high income)Europe & Central Asia (IDA & IBRD countries)European UnionFijiFinlandFragile and conflict affected situationsFranceGabonGambia, TheGeorgiaGermanyGhanaGreeceGuatemalaGuineaGuinea-BissauGuyanaHaitiHeavily indebted poor countries (HIPC)High incomeHondurasHungaryIBRD onlyIDA & IBRD totalIDA blendIDA onlyIDA totalIndiaIndonesiaIran, Islamic Rep.IraqIrelandIsraelItalyJamaicaJapanJordanKazakhstanKenyaKiribatiKorea, Rep.KuwaitKyrgyz RepublicLao PDRLate-demographic dividendLatin America & Caribbean Latin America & Caribbean (excluding high income)Latin America & the Caribbean (IDA & IBRD countries)LatviaLeast developed countries: UN classificationLebanonLesothoLiberiaLibyaLithuaniaLow & middle incomeLow incomeLower middle incomeLuxembourgMacedonia, FYRMadagascarMalawiMalaysiaMaldivesMaliMauritaniaMauritiusMexicoMiddle East & North AfricaMiddle East & North Africa (excluding high income)Middle East & North Africa (IDA & IBRD countries)Middle incomeMoldovaMongoliaMoroccoMozambiqueNamibiaNepalNetherlandsNew ZealandNicaraguaNigerNigeriaNorth AmericaNorwayOECD membersOmanOther small statesPacific island small statesPakistanPanamaPapua New GuineaParaguayPeruPhilippinesPolandPortugalPost-demographic dividendPre-demographic dividendQatarRomaniaRussian FederationRwandaSamoaSao Tome and PrincipeSaudi ArabiaSenegalSeychellesSierra LeoneSingaporeSlovak RepublicSloveniaSmall statesSolomon IslandsSouth AfricaSouth AsiaSouth Asia (IDA & IBRD)SpainSri LankaSt. LuciaSt. Vincent and the GrenadinesSub-Saharan Africa Sub-Saharan Africa (excluding high income)Sub-Saharan Africa (IDA & IBRD countries)SurinameSwazilandSwedenSwitzerlandTajikistanTanzaniaThailandTogoTongaTrinidad and TobagoTunisiaTurkeyTurkmenistanUgandaUkraineUnited Arab EmiratesUnited KingdomUnited StatesUpper middle incomeUruguayUzbekistanVanuatuVenezuela, RBVietnamWorldYemen, Rep.ZambiaZimbabwe Zeitlinie:
Diese Zeitleiste vorliegt die Graphik ab 1983 J. bis 2015 J. Latin America & Caribbean (excluding high income). Die Angaben bis 1982 J. sind nicht vorhanden. Die Zahl aktueller Beobachtungen nach Daten: 33.
Die Quelle (Bezeichnung):
Kennzahlen der Weltentwicklung
Die Quelle (Einrichtung):
World Bank staff estimates based on sources and methods in World Bank's "The Changing Wealth of Nations: Measuring Sustainable Development in the New Millennium" (2011).
Kategorien:
Economy & Growth
Es wurde aktualisiert:
23 Apr 2017 Jahr
Kennzahlen der Wertänderungen vom Jahr zum Jahr
im Durchschnitt:
2.843 Trln
Minimum:
1.648 Trln
1 Jan 1984 Jahr
Maximum:
4.563 Trln
1 Jan 2015 Jahr
Zum Datum der Beobachtung
Wert
Absolute Veränderung
Die Veränderung bezüglich dem vorherigen Wert
1 Jan 1983 Jahr
2.165 Trln
+2.165 Trln
0.0%
1 Jan 1984 Jahr
1.648 Trln
-516.581 Mlrd.
-23.86%
1 Jan 1985 Jahr
1.813 Trln
+164.611 Mlrd.
9.99%
1 Jan 1986 Jahr
1.88 Trln
+67.218 Mlrd.
3.71%
1 Jan 1987 Jahr
1.983 Trln
+103.149 Mlrd.
5.49%
1 Jan 1988 Jahr
2.044 Trln
+60.783 Mlrd.
3.06%
1 Jan 1989 Jahr
2.051 Trln
+6.893 Mlrd.
0.34%
1 Jan 1990 Jahr
2.177 Trln
+126.538 Mlrd.
6.17%
1 Jan 1991 Jahr
2.036 Trln
-141.207 Mlrd.
-6.48%
1 Jan 1992 Jahr
2.141 Trln
+104.538 Mlrd.
5.13%
1 Jan 1993 Jahr
2.22 Trln
+79.606 Mlrd.
3.72%
1 Jan 1994 Jahr
2.315 Trln
+94.195 Mlrd.
4.24%
1 Jan 1995 Jahr
2.426 Trln
+111.532 Mlrd.
4.82%
1 Jan 1996 Jahr
2.434 Trln
+7.726 Mlrd.
0.32%
1 Jan 1997 Jahr
2.533 Trln
+99.008 Mlrd.
4.07%
1 Jan 1998 Jahr
2.697 Trln
+163.924 Mlrd.
6.47%
1 Jan 1999 Jahr
2.719 Trln
+21.996 Mlrd.
0.82%
1 Jan 2000 Jahr
2.673 Trln
-45.875 Mlrd.
-1.69%
1 Jan 2001 Jahr
2.788 Trln
+115.572 Mlrd.
4.32%
1 Jan 2002 Jahr
2.797 Trln
+8.827 Mlrd.
0.32%
1 Jan 2003 Jahr
2.788 Trln
-9.427 Mlrd.
-0.34%
1 Jan 2004 Jahr
2.818 Trln
+30.277 Mlrd.
1.09%
1 Jan 2005 Jahr
3.049 Trln
+230.642 Mlrd.
8.18%
1 Jan 2006 Jahr
3.177 Trln
+128.384 Mlrd.
4.21%
1 Jan 2007 Jahr
3.397 Trln
+219.59 Mlrd.
6.91%
1 Jan 2008 Jahr
3.652 Trln
+254.767 Mlrd.
7.5%
1 Jan 2009 Jahr
3.802 Trln
+150.297 Mlrd.
4.12%
1 Jan 2010 Jahr
3.747 Trln
-54.845 Mlrd.
-1.44%
1 Jan 2011 Jahr
4.136 Trln
+388.788 Mlrd.
10.38%
1 Jan 2012 Jahr
4.284 Trln
+148.414 Mlrd.
3.59%
1 Jan 2013 Jahr
4.386 Trln
+101.646 Mlrd.
2.37%
1 Jan 2014 Jahr
4.487 Trln
+101.161 Mlrd.
2.31%
1 Jan 2015 Jahr
4.563 Trln
+75.93 Mlrd.
1.69%
Bewertung der Länder gemäß mit laufender Statistik nach Jahren


Kommentare: