29
/de/
de
AIzaSyAYiBZKx7MnpbEhh9jyipgxe19OcubqV5w
April 1, 2024
61660
Upper middle income
UMC
false
2
1
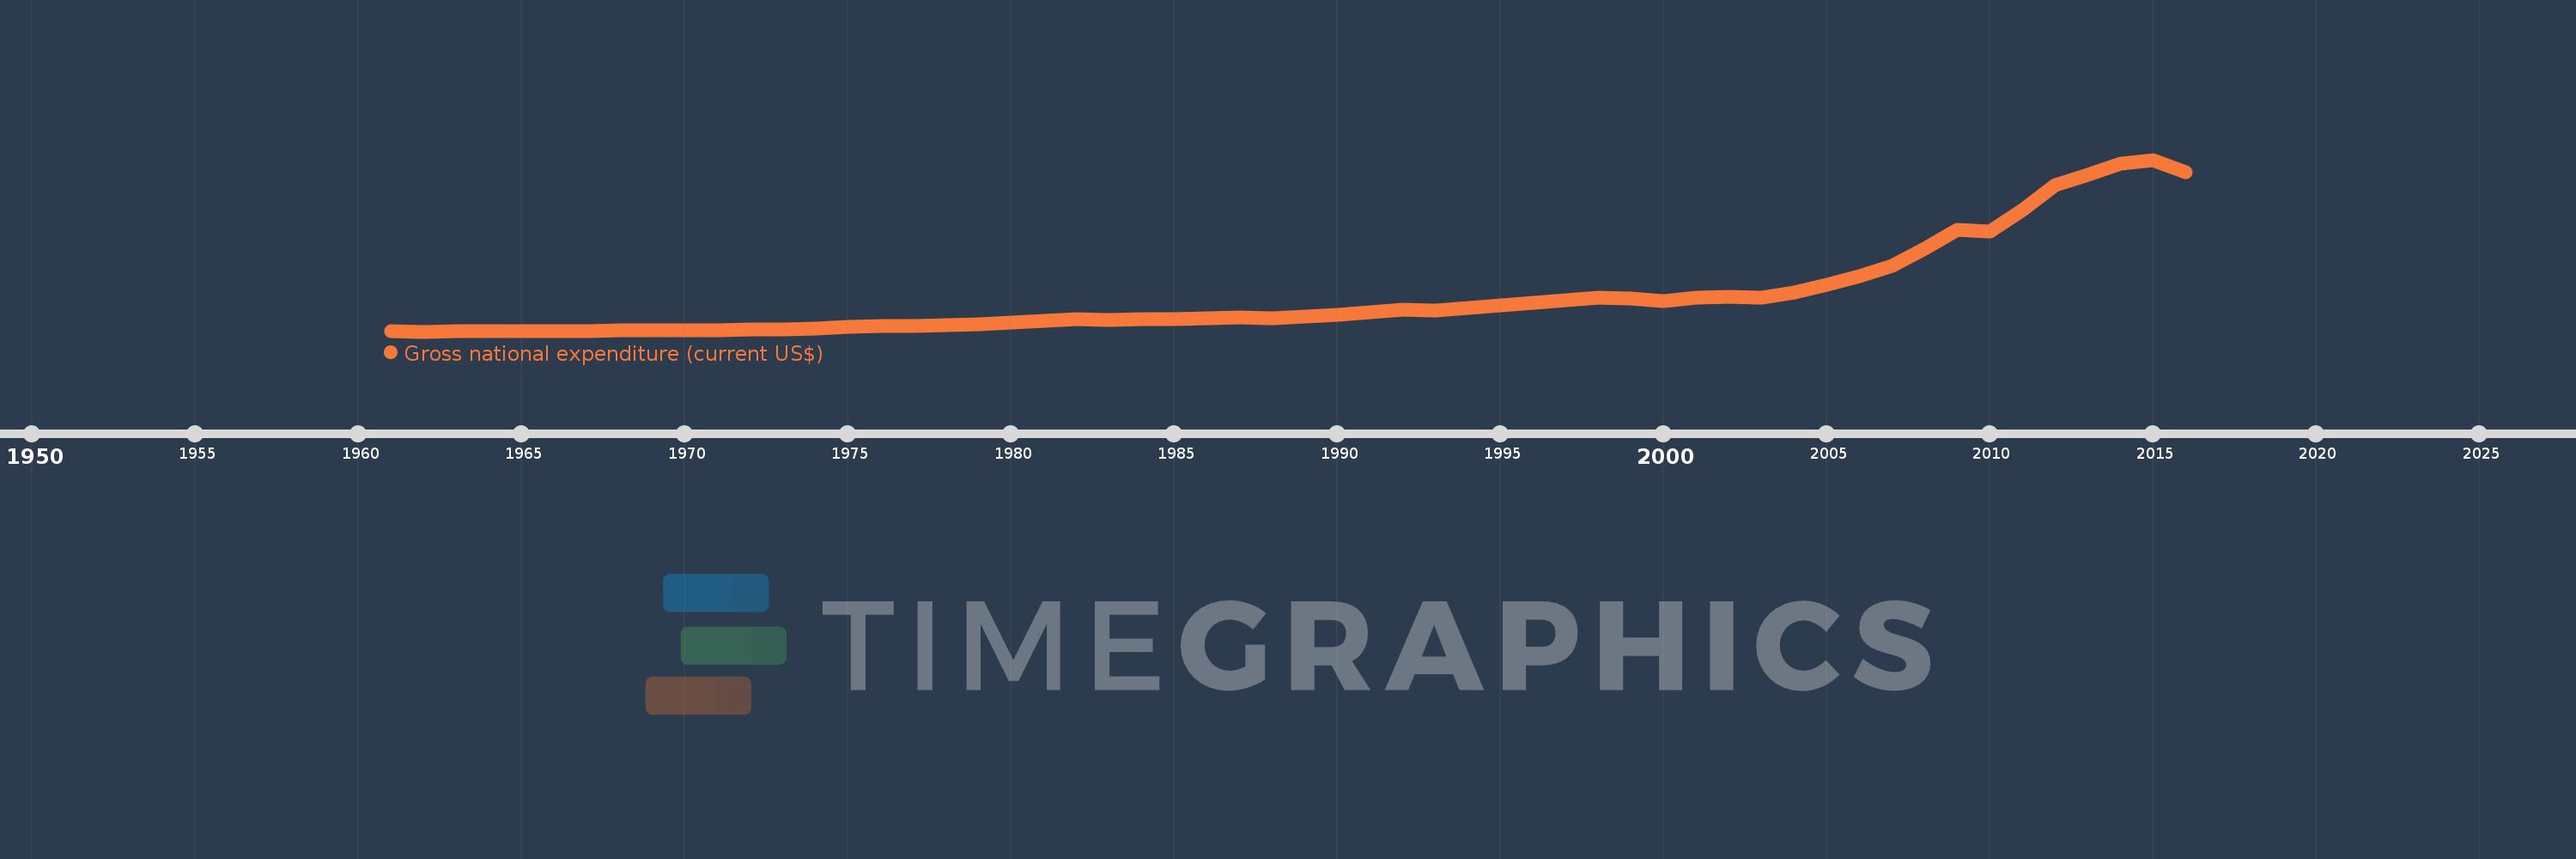
Gross national expenditure (current US$)
2016,2015,2014,2013,2012,2011,2010,2009,2008,2007,2006,2005,2004,2003,2002,2001,2000,1999,1998,1997,1996,1995,1994,1993,1992,1991,1990,1989,1988,1987,1986,1985,1984,1983,1982,1981,1980,1979,1978,1977,1976,1975,1974,1973,1972,1971,1970,1969,1968,1967,1966,1965,1964,1963,1962,1961
Diese Statistik in anderen Ländern:
AfghanistanAlbaniaAlgeriaAngolaAntigua and BarbudaArab WorldArgentinaArmeniaArubaAustraliaAustriaAzerbaijanBahamas, TheBahrainBangladeshBarbadosBelarusBelgiumBelizeBeninBermudaBhutanBoliviaBosnia and HerzegovinaBotswanaBrazilBrunei DarussalamBulgariaBurkina FasoBurundiCabo VerdeCambodiaCameroonCanadaCaribbean small statesCentral African RepublicCentral Europe and the BalticsChadChileChinaColombiaComorosCongo, Dem. Rep.Congo, Rep.Costa RicaCote d'IvoireCroatiaCubaCyprusCzech RepublicDenmarkDjiboutiDominicaDominican RepublicEarly-demographic dividendEast Asia & PacificEast Asia & Pacific (excluding high income)East Asia & Pacific (IDA & IBRD countries)EcuadorEgypt, Arab Rep.El SalvadorEquatorial GuineaEritreaEstoniaEthiopiaEuro areaEurope & Central AsiaEurope & Central Asia (excluding high income)Europe & Central Asia (IDA & IBRD countries)European UnionFaroe IslandsFijiFinlandFragile and conflict affected situationsFranceFrench PolynesiaGabonGambia, TheGeorgiaGermanyGhanaGreeceGrenadaGuatemalaGuineaGuinea-BissauGuyanaHaitiHeavily indebted poor countries (HIPC)High incomeHondurasHong Kong SAR, ChinaHungaryIBRD onlyIcelandIDA & IBRD totalIDA blendIDA onlyIDA totalIndiaIndonesiaIran, Islamic Rep.IraqIrelandIsraelItalyJamaicaJapanJordanKazakhstanKenyaKiribatiKorea, Rep.KosovoKuwaitKyrgyz RepublicLao PDRLate-demographic dividendLatin America & Caribbean Latin America & Caribbean (excluding high income)Latin America & the Caribbean (IDA & IBRD countries)LatviaLeast developed countries: UN classificationLebanonLesothoLiberiaLibyaLithuaniaLow & middle incomeLow incomeLower middle incomeLuxembourgMacao SAR, ChinaMacedonia, FYRMadagascarMalawiMalaysiaMaldivesMaliMaltaMauritaniaMauritiusMexicoMicronesia, Fed. Sts.Middle East & North AfricaMiddle East & North Africa (excluding high income)Middle East & North Africa (IDA & IBRD countries)Middle incomeMoldovaMongoliaMontenegroMoroccoMozambiqueMyanmarNamibiaNepalNetherlandsNew CaledoniaNew ZealandNicaraguaNigerNigeriaNorth AmericaNorwayOECD membersOmanOther small statesPacific island small statesPakistanPalauPanamaPapua New GuineaParaguayPeruPhilippinesPolandPortugalPost-demographic dividendPre-demographic dividendPuerto RicoQatarRomaniaRussian FederationRwandaSamoaSaudi ArabiaSenegalSerbiaSeychellesSierra LeoneSingaporeSlovak RepublicSloveniaSmall statesSolomon IslandsSomaliaSouth AfricaSouth AsiaSouth Asia (IDA & IBRD)South SudanSpainSri LankaSt. Kitts and NevisSt. LuciaSt. Vincent and the GrenadinesSub-Saharan Africa Sub-Saharan Africa (excluding high income)Sub-Saharan Africa (IDA & IBRD countries)SudanSurinameSwazilandSwedenSwitzerlandSyrian Arab RepublicTajikistanTanzaniaThailandTimor-LesteTogoTongaTrinidad and TobagoTunisiaTurkeyTurkmenistanUgandaUkraineUnited Arab EmiratesUnited KingdomUnited StatesUpper middle incomeUruguayUzbekistanVanuatuVenezuela, RBVietnamWest Bank and GazaWorldYemen, Rep.ZambiaZimbabwe Zeitlinie:
Diese Zeitleiste vorliegt die Graphik ab 1961 J. bis 2016 J. Upper middle income. Die Angaben bis 1960 J. sind nicht vorhanden. Die Zahl aktueller Beobachtungen nach Daten: 56.
Die Quelle (Bezeichnung):
Kennzahlen der Weltentwicklung
Die Quelle (Einrichtung):
World Bank national accounts data, and OECD National Accounts data files.
Kategorien:
Economy & Growth
Es wurde aktualisiert:
23 Apr 2017 Jahr
Kennzahlen der Wertänderungen vom Jahr zum Jahr
im Durchschnitt:
4.576 Trln
Minimum:
181.118 Mlrd.
1 Jan 1962 Jahr
Maximum:
21.627 Trln
1 Jan 2015 Jahr
Zum Datum der Beobachtung
Wert
Absolute Veränderung
Die Veränderung bezüglich dem vorherigen Wert
1 Jan 1961 Jahr
203.513 Mlrd.
+203.513 Mlrd.
0.0%
1 Jan 1962 Jahr
181.118 Mlrd.
-22.395 Mlrd.
-11.0%
1 Jan 1963 Jahr
182.301 Mlrd.
+1.183 Mlrd.
0.65%
1 Jan 1964 Jahr
200.205 Mlrd.
+17.904 Mlrd.
9.82%
1 Jan 1965 Jahr
227.197 Mlrd.
+26.992 Mlrd.
13.48%
1 Jan 1966 Jahr
258.125 Mlrd.
+30.928 Mlrd.
13.61%
1 Jan 1967 Jahr
282.444 Mlrd.
+24.319 Mlrd.
9.42%
1 Jan 1968 Jahr
289.726 Mlrd.
+7.282 Mlrd.
2.58%
1 Jan 1969 Jahr
301.081 Mlrd.
+11.355 Mlrd.
3.92%
1 Jan 1970 Jahr
335.271 Mlrd.
+34.19 Mlrd.
11.36%
1 Jan 1971 Jahr
372.337 Mlrd.
+37.066 Mlrd.
11.06%
1 Jan 1972 Jahr
404.336 Mlrd.
+31.999 Mlrd.
8.59%
1 Jan 1973 Jahr
474.101 Mlrd.
+69.765 Mlrd.
17.25%
1 Jan 1974 Jahr
607.997 Mlrd.
+133.896 Mlrd.
28.24%
1 Jan 1975 Jahr
762.462 Mlrd.
+154.465 Mlrd.
25.41%
1 Jan 1976 Jahr
867.304 Mlrd.
+104.842 Mlrd.
13.75%
1 Jan 1977 Jahr
905.069 Mlrd.
+37.765 Mlrd.
4.35%
1 Jan 1978 Jahr
1.015 Trln
+109.625 Mlrd.
12.11%
1 Jan 1979 Jahr
1.065 Trln
+50.016 Mlrd.
4.93%
1 Jan 1980 Jahr
1.284 Trln
+219.411 Mlrd.
20.61%
1 Jan 1981 Jahr
1.531 Trln
+247.191 Mlrd.
19.25%
1 Jan 1982 Jahr
1.72 Trln
+188.312 Mlrd.
12.3%
1 Jan 1983 Jahr
1.631 Trln
-88.542 Mlrd.
-5.15%
1 Jan 1984 Jahr
1.706 Trln
+74.54 Mlrd.
4.57%
1 Jan 1985 Jahr
1.718 Trln
+12.382 Mlrd.
0.73%
1 Jan 1986 Jahr
1.832 Trln
+113.951 Mlrd.
6.63%
1 Jan 1987 Jahr
1.942 Trln
+110.384 Mlrd.
6.03%
1 Jan 1988 Jahr
1.894 Trln
-48.358 Mlrd.
-2.49%
1 Jan 1989 Jahr
2.104 Trln
+209.875 Mlrd.
11.08%
1 Jan 1990 Jahr
2.296 Trln
+191.913 Mlrd.
9.12%
1 Jan 1991 Jahr
2.638 Trln
+342.024 Mlrd.
14.9%
1 Jan 1992 Jahr
2.934 Trln
+295.71 Mlrd.
11.21%
1 Jan 1993 Jahr
2.814 Trln
-119.374 Mlrd.
-4.07%
1 Jan 1994 Jahr
3.125 Trln
+310.581 Mlrd.
11.04%
1 Jan 1995 Jahr
3.399 Trln
+274.287 Mlrd.
8.78%
1 Jan 1996 Jahr
3.795 Trln
+396.366 Mlrd.
11.66%
1 Jan 1997 Jahr
4.112 Trln
+316.15 Mlrd.
8.33%
1 Jan 1998 Jahr
4.394 Trln
+282.137 Mlrd.
6.86%
1 Jan 1999 Jahr
4.296 Trln
-97.843 Mlrd.
-2.23%
1 Jan 2000 Jahr
4.012 Trln
-284.059 Mlrd.
-6.61%
1 Jan 2001 Jahr
4.404 Trln
+392.557 Mlrd.
9.79%
1 Jan 2002 Jahr
4.488 Trln
+83.876 Mlrd.
1.9%
1 Jan 2003 Jahr
4.463 Trln
-25.321 Mlrd.
-0.56%
1 Jan 2004 Jahr
5.009 Trln
+545.97 Mlrd.
12.23%
1 Jan 2005 Jahr
6.001 Trln
+991.754 Mlrd.
19.8%
1 Jan 2006 Jahr
7.107 Trln
+1.107 Trln
18.45%
1 Jan 2007 Jahr
8.368 Trln
+1.26 Trln
17.73%
1 Jan 2008 Jahr
10.485 Trln
+2.117 Trln
25.3%
1 Jan 2009 Jahr
12.928 Trln
+2.443 Trln
23.3%
1 Jan 2010 Jahr
12.684 Trln
-243.865 Mlrd.
-1.89%
1 Jan 2011 Jahr
15.338 Trln
+2.654 Trln
20.93%
1 Jan 2012 Jahr
18.419 Trln
+3.08 Trln
20.08%
1 Jan 2013 Jahr
19.702 Trln
+1.284 Trln
6.97%
1 Jan 2014 Jahr
21.091 Trln
+1.389 Trln
7.05%
1 Jan 2015 Jahr
21.627 Trln
+535.718 Mlrd.
2.54%
1 Jan 2016 Jahr
20.055 Trln
-1.572 Trln
-7.27%
Bewertung der Länder gemäß mit laufender Statistik nach Jahren


Kommentare: