29
/de/
de
AIzaSyAYiBZKx7MnpbEhh9jyipgxe19OcubqV5w
April 1, 2024
50957
Middle income
MIC
false
2
1
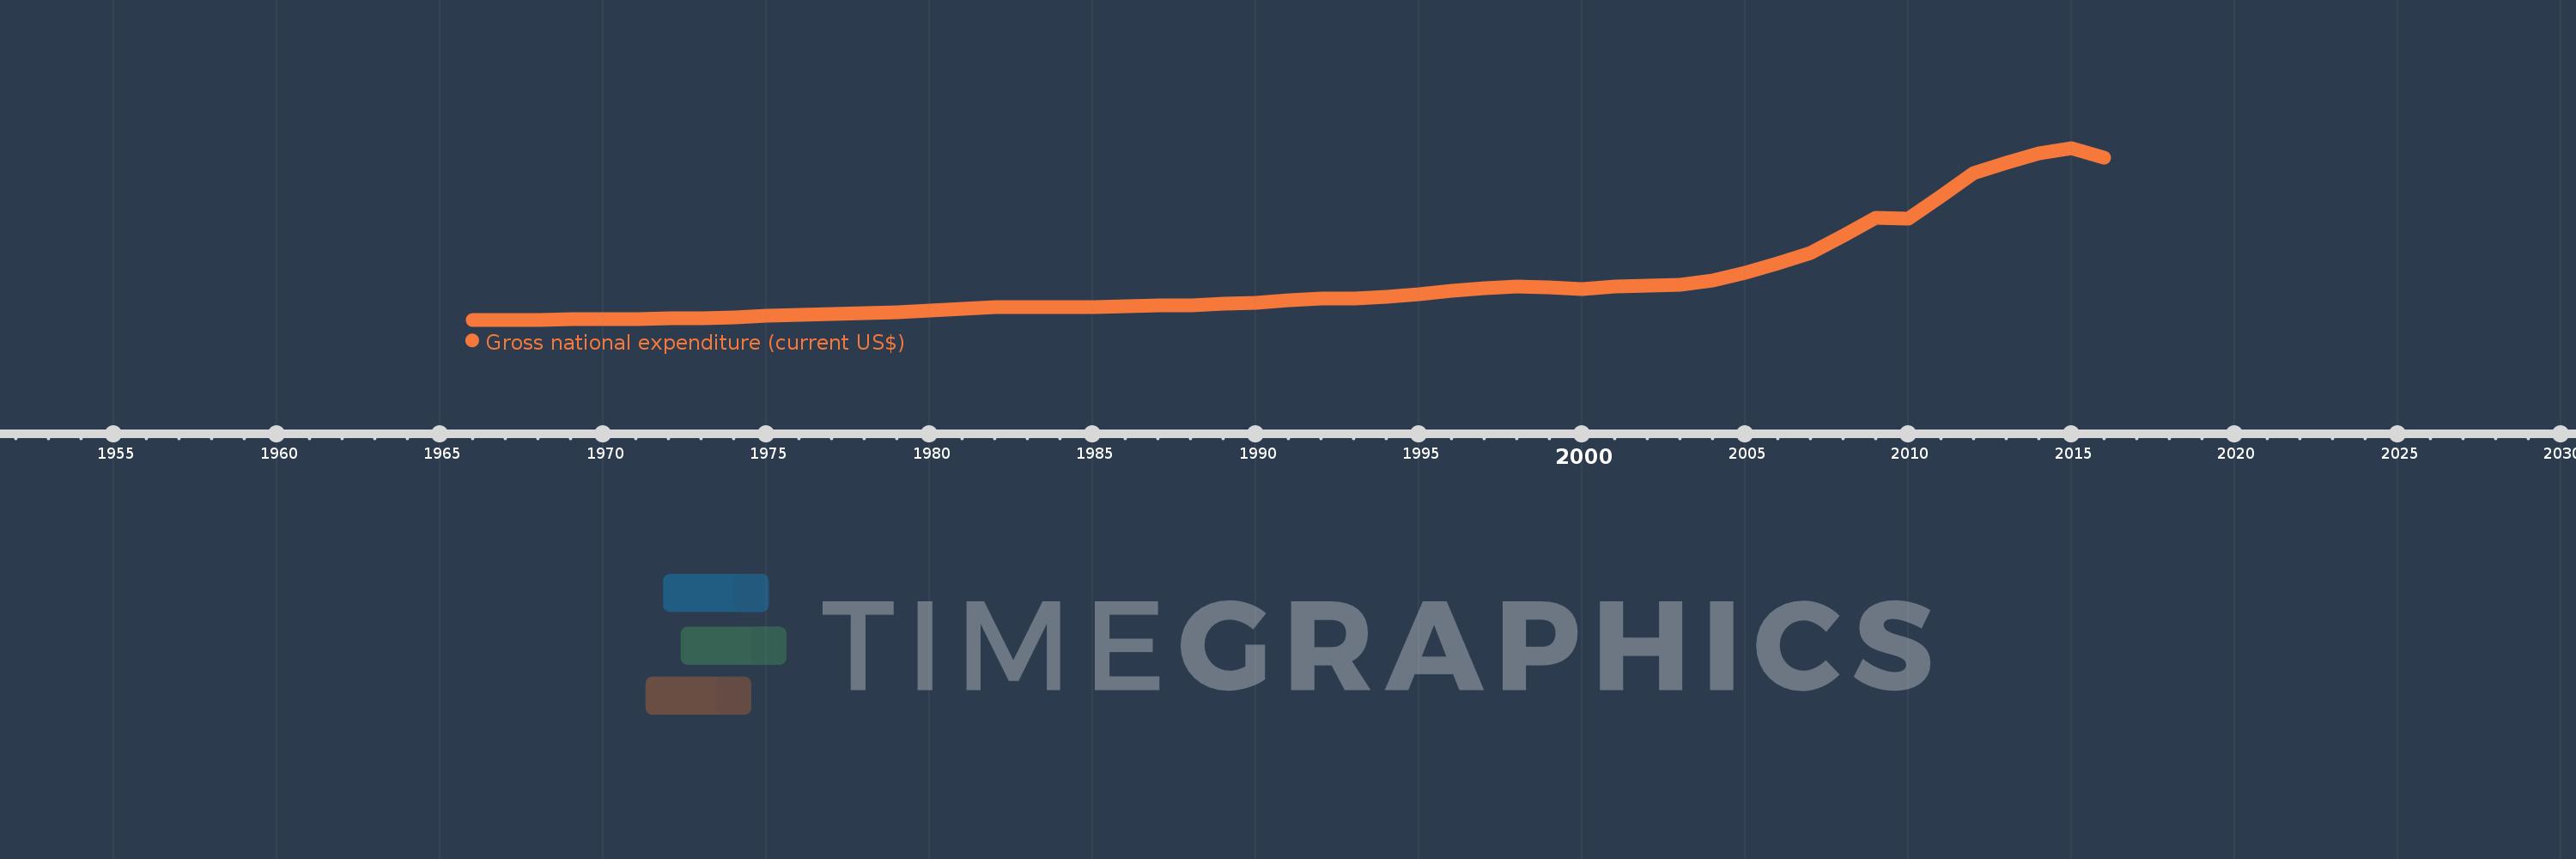
Gross national expenditure (current US$)
2016,2015,2014,2013,2012,2011,2010,2009,2008,2007,2006,2005,2004,2003,2002,2001,2000,1999,1998,1997,1996,1995,1994,1993,1992,1991,1990,1989,1988,1987,1986,1985,1984,1983,1982,1981,1980,1979,1978,1977,1976,1975,1974,1973,1972,1971,1970,1969,1968,1967,1966
Diese Statistik in anderen Ländern:
AfghanistanAlbaniaAlgeriaAngolaAntigua and BarbudaArab WorldArgentinaArmeniaArubaAustraliaAustriaAzerbaijanBahamas, TheBahrainBangladeshBarbadosBelarusBelgiumBelizeBeninBermudaBhutanBoliviaBosnia and HerzegovinaBotswanaBrazilBrunei DarussalamBulgariaBurkina FasoBurundiCabo VerdeCambodiaCameroonCanadaCaribbean small statesCentral African RepublicCentral Europe and the BalticsChadChileChinaColombiaComorosCongo, Dem. Rep.Congo, Rep.Costa RicaCote d'IvoireCroatiaCubaCyprusCzech RepublicDenmarkDjiboutiDominicaDominican RepublicEarly-demographic dividendEast Asia & PacificEast Asia & Pacific (excluding high income)East Asia & Pacific (IDA & IBRD countries)EcuadorEgypt, Arab Rep.El SalvadorEquatorial GuineaEritreaEstoniaEthiopiaEuro areaEurope & Central AsiaEurope & Central Asia (excluding high income)Europe & Central Asia (IDA & IBRD countries)European UnionFaroe IslandsFijiFinlandFragile and conflict affected situationsFranceFrench PolynesiaGabonGambia, TheGeorgiaGermanyGhanaGreeceGrenadaGuatemalaGuineaGuinea-BissauGuyanaHaitiHeavily indebted poor countries (HIPC)High incomeHondurasHong Kong SAR, ChinaHungaryIBRD onlyIcelandIDA & IBRD totalIDA blendIDA onlyIDA totalIndiaIndonesiaIran, Islamic Rep.IraqIrelandIsraelItalyJamaicaJapanJordanKazakhstanKenyaKiribatiKorea, Rep.KosovoKuwaitKyrgyz RepublicLao PDRLate-demographic dividendLatin America & Caribbean Latin America & Caribbean (excluding high income)Latin America & the Caribbean (IDA & IBRD countries)LatviaLeast developed countries: UN classificationLebanonLesothoLiberiaLibyaLithuaniaLow & middle incomeLow incomeLower middle incomeLuxembourgMacao SAR, ChinaMacedonia, FYRMadagascarMalawiMalaysiaMaldivesMaliMaltaMauritaniaMauritiusMexicoMicronesia, Fed. Sts.Middle East & North AfricaMiddle East & North Africa (excluding high income)Middle East & North Africa (IDA & IBRD countries)Middle incomeMoldovaMongoliaMontenegroMoroccoMozambiqueMyanmarNamibiaNepalNetherlandsNew CaledoniaNew ZealandNicaraguaNigerNigeriaNorth AmericaNorwayOECD membersOmanOther small statesPacific island small statesPakistanPalauPanamaPapua New GuineaParaguayPeruPhilippinesPolandPortugalPost-demographic dividendPre-demographic dividendPuerto RicoQatarRomaniaRussian FederationRwandaSamoaSaudi ArabiaSenegalSerbiaSeychellesSierra LeoneSingaporeSlovak RepublicSloveniaSmall statesSolomon IslandsSomaliaSouth AfricaSouth AsiaSouth Asia (IDA & IBRD)South SudanSpainSri LankaSt. Kitts and NevisSt. LuciaSt. Vincent and the GrenadinesSub-Saharan Africa Sub-Saharan Africa (excluding high income)Sub-Saharan Africa (IDA & IBRD countries)SudanSurinameSwazilandSwedenSwitzerlandSyrian Arab RepublicTajikistanTanzaniaThailandTimor-LesteTogoTongaTrinidad and TobagoTunisiaTurkeyTurkmenistanUgandaUkraineUnited Arab EmiratesUnited KingdomUnited StatesUpper middle incomeUruguayUzbekistanVanuatuVenezuela, RBVietnamWest Bank and GazaWorldYemen, Rep.ZambiaZimbabwe Zeitlinie:
Diese Zeitleiste vorliegt die Graphik ab 1966 J. bis 2016 J. Middle income. Die Angaben bis 1965 J. sind nicht vorhanden. Die Zahl aktueller Beobachtungen nach Daten: 51.
Die Quelle (Bezeichnung):
Kennzahlen der Weltentwicklung
Die Quelle (Einrichtung):
World Bank national accounts data, and OECD National Accounts data files.
Kategorien:
Economy & Growth
Es wurde aktualisiert:
23 Apr 2017 Jahr
Kennzahlen der Wertänderungen vom Jahr zum Jahr
im Durchschnitt:
6.553 Trln
Minimum:
406.541 Mlrd.
1 Jan 1966 Jahr
Maximum:
27.707 Trln
1 Jan 2015 Jahr
Zum Datum der Beobachtung
Wert
Absolute Veränderung
Die Veränderung bezüglich dem vorherigen Wert
1 Jan 1966 Jahr
406.541 Mlrd.
+406.541 Mlrd.
0.0%
1 Jan 1967 Jahr
411.992 Mlrd.
+5.45 Mlrd.
1.34%
1 Jan 1968 Jahr
427.865 Mlrd.
+15.874 Mlrd.
3.85%
1 Jan 1969 Jahr
448.367 Mlrd.
+20.501 Mlrd.
4.79%
1 Jan 1970 Jahr
498.875 Mlrd.
+50.508 Mlrd.
11.26%
1 Jan 1971 Jahr
552.451 Mlrd.
+53.577 Mlrd.
10.74%
1 Jan 1972 Jahr
590.887 Mlrd.
+38.436 Mlrd.
6.96%
1 Jan 1973 Jahr
667.908 Mlrd.
+77.021 Mlrd.
13.03%
1 Jan 1974 Jahr
834.781 Mlrd.
+166.873 Mlrd.
24.98%
1 Jan 1975 Jahr
1.054 Trln
+219.293 Mlrd.
26.27%
1 Jan 1976 Jahr
1.204 Trln
+150.245 Mlrd.
14.25%
1 Jan 1977 Jahr
1.27 Trln
+65.285 Mlrd.
5.42%
1 Jan 1978 Jahr
1.427 Trln
+157.209 Mlrd.
12.38%
1 Jan 1979 Jahr
1.539 Trln
+112.29 Mlrd.
7.87%
1 Jan 1980 Jahr
1.813 Trln
+274.338 Mlrd.
17.82%
1 Jan 1981 Jahr
2.184 Trln
+370.896 Mlrd.
20.45%
1 Jan 1982 Jahr
2.427 Trln
+242.713 Mlrd.
11.11%
1 Jan 1983 Jahr
2.352 Trln
-75.516 Mlrd.
-3.11%
1 Jan 1984 Jahr
2.407 Trln
+55.589 Mlrd.
2.36%
1 Jan 1985 Jahr
2.407 Trln
-135.708 Mln.
-0.01%
1 Jan 1986 Jahr
2.561 Trln
+153.694 Mlrd.
6.39%
1 Jan 1987 Jahr
2.688 Trln
+127.729 Mlrd.
4.99%
1 Jan 1988 Jahr
2.714 Trln
+25.378 Mlrd.
0.94%
1 Jan 1989 Jahr
2.945 Trln
+231.672 Mlrd.
8.54%
1 Jan 1990 Jahr
3.128 Trln
+182.817 Mlrd.
6.21%
1 Jan 1991 Jahr
3.548 Trln
+420.061 Mlrd.
13.43%
1 Jan 1992 Jahr
3.803 Trln
+254.7 Mlrd.
7.18%
1 Jan 1993 Jahr
3.74 Trln
-62.859 Mlrd.
-1.65%
1 Jan 1994 Jahr
4.068 Trln
+327.812 Mlrd.
8.76%
1 Jan 1995 Jahr
4.429 Trln
+361.047 Mlrd.
8.88%
1 Jan 1996 Jahr
4.959 Trln
+530.426 Mlrd.
11.98%
1 Jan 1997 Jahr
5.389 Trln
+429.967 Mlrd.
8.67%
1 Jan 1998 Jahr
5.715 Trln
+325.755 Mlrd.
6.04%
1 Jan 1999 Jahr
5.492 Trln
-223.177 Mlrd.
-3.9%
1 Jan 2000 Jahr
5.293 Trln
-198.787 Mlrd.
-3.62%
1 Jan 2001 Jahr
5.73 Trln
+436.615 Mlrd.
8.25%
1 Jan 2002 Jahr
5.845 Trln
+115.512 Mlrd.
2.02%
1 Jan 2003 Jahr
5.917 Trln
+71.271 Mlrd.
1.22%
1 Jan 2004 Jahr
6.673 Trln
+756.811 Mlrd.
12.79%
1 Jan 2005 Jahr
7.905 Trln
+1.231 Trln
18.45%
1 Jan 2006 Jahr
9.313 Trln
+1.408 Trln
17.81%
1 Jan 2007 Jahr
10.964 Trln
+1.652 Trln
17.73%
1 Jan 2008 Jahr
13.708 Trln
+2.744 Trln
25.03%
1 Jan 2009 Jahr
16.564 Trln
+2.856 Trln
20.83%
1 Jan 2010 Jahr
16.418 Trln
-146.279 Mlrd.
-0.88%
1 Jan 2011 Jahr
20.005 Trln
+3.587 Trln
21.85%
1 Jan 2012 Jahr
23.722 Trln
+3.716 Trln
18.58%
1 Jan 2013 Jahr
25.286 Trln
+1.565 Trln
6.6%
1 Jan 2014 Jahr
26.89 Trln
+1.603 Trln
6.34%
1 Jan 2015 Jahr
27.707 Trln
+817.723 Mlrd.
3.04%
1 Jan 2016 Jahr
26.153 Trln
-1.554 Trln
-5.61%
Bewertung der Länder gemäß mit laufender Statistik nach Jahren


Kommentare: