29
/de/
de
AIzaSyAYiBZKx7MnpbEhh9jyipgxe19OcubqV5w
April 1, 2024
27337
East Asia & Pacific
EAS
false
2
1
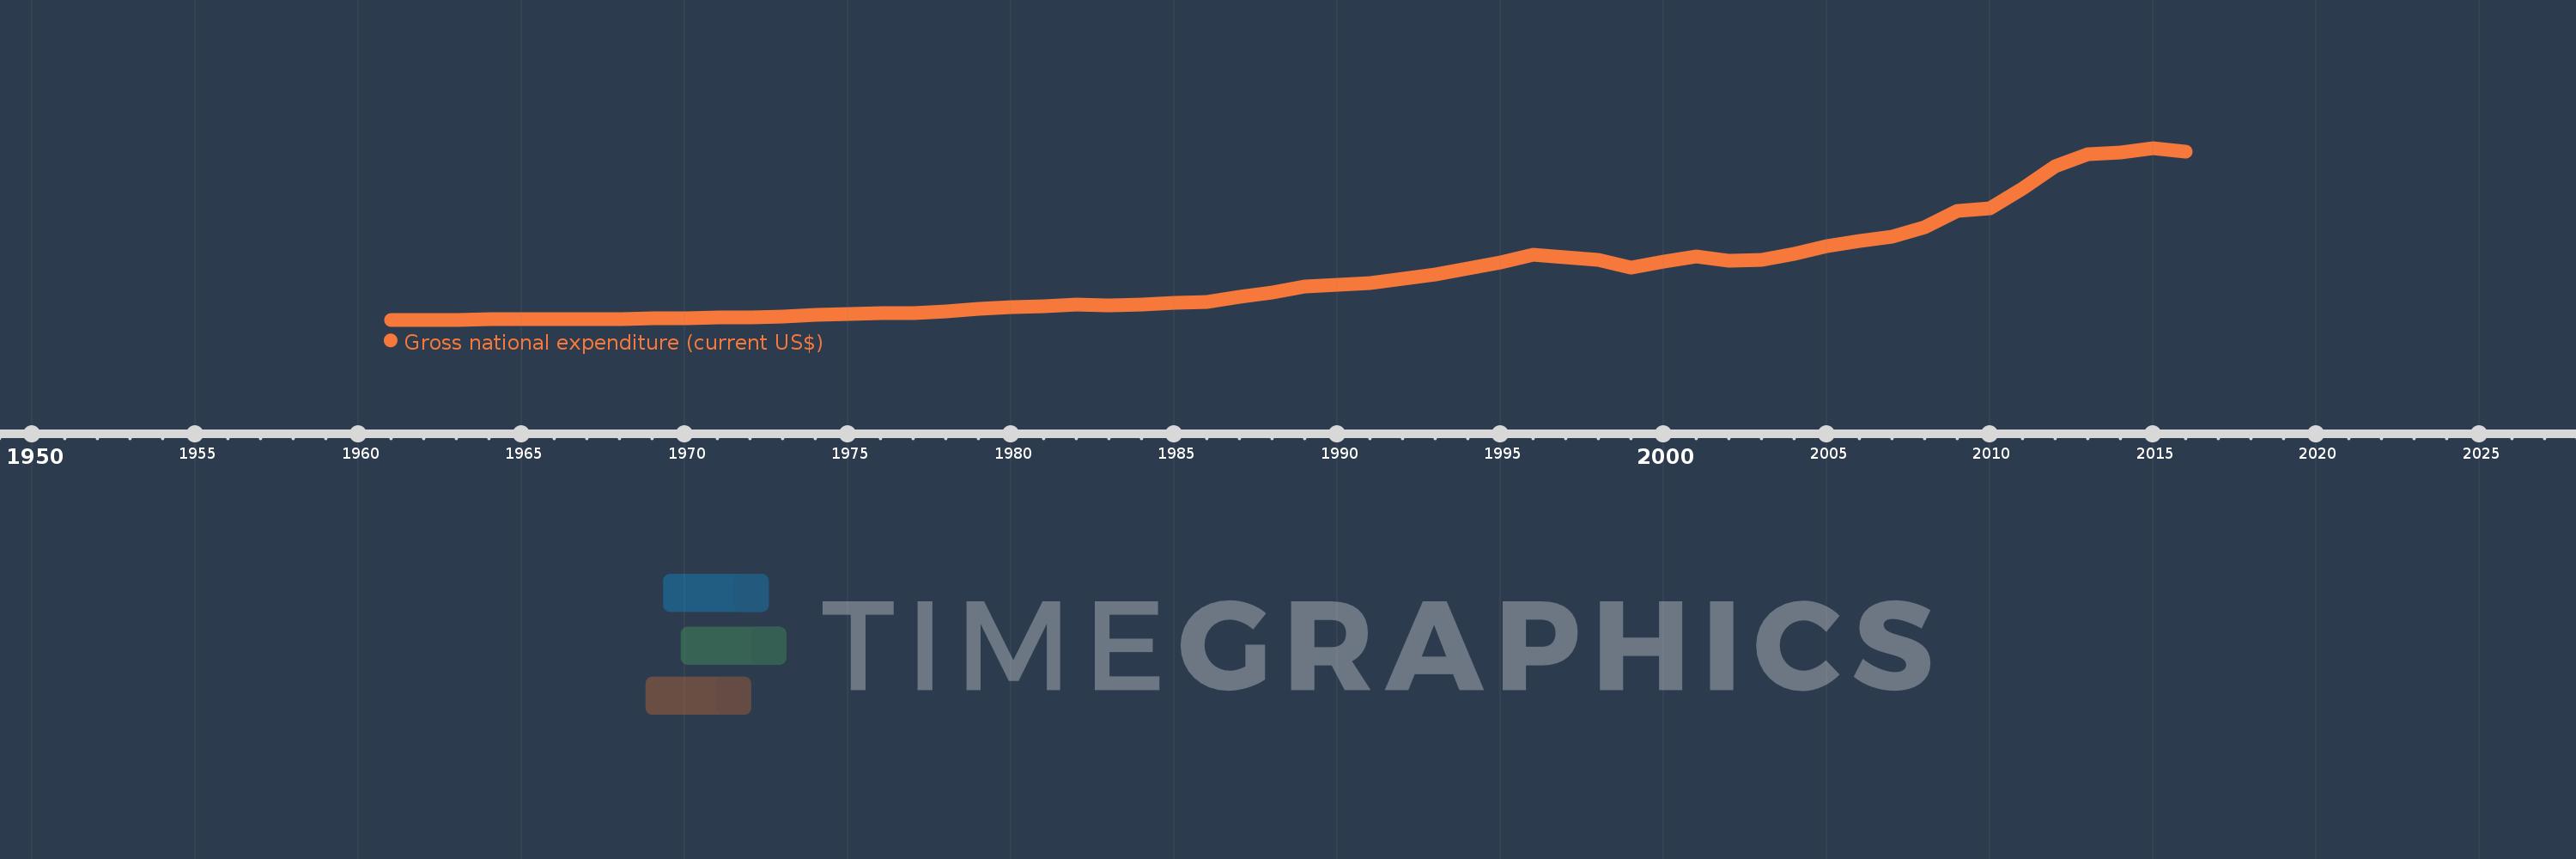
Gross national expenditure (current US$)
2016,2015,2014,2013,2012,2011,2010,2009,2008,2007,2006,2005,2004,2003,2002,2001,2000,1999,1998,1997,1996,1995,1994,1993,1992,1991,1990,1989,1988,1987,1986,1985,1984,1983,1982,1981,1980,1979,1978,1977,1976,1975,1974,1973,1972,1971,1970,1969,1968,1967,1966,1965,1964,1963,1962,1961
Diese Statistik in anderen Ländern:
AfghanistanAlbaniaAlgeriaAngolaAntigua and BarbudaArab WorldArgentinaArmeniaArubaAustraliaAustriaAzerbaijanBahamas, TheBahrainBangladeshBarbadosBelarusBelgiumBelizeBeninBermudaBhutanBoliviaBosnia and HerzegovinaBotswanaBrazilBrunei DarussalamBulgariaBurkina FasoBurundiCabo VerdeCambodiaCameroonCanadaCaribbean small statesCentral African RepublicCentral Europe and the BalticsChadChileChinaColombiaComorosCongo, Dem. Rep.Congo, Rep.Costa RicaCote d'IvoireCroatiaCubaCyprusCzech RepublicDenmarkDjiboutiDominicaDominican RepublicEarly-demographic dividendEast Asia & PacificEast Asia & Pacific (excluding high income)East Asia & Pacific (IDA & IBRD countries)EcuadorEgypt, Arab Rep.El SalvadorEquatorial GuineaEritreaEstoniaEthiopiaEuro areaEurope & Central AsiaEurope & Central Asia (excluding high income)Europe & Central Asia (IDA & IBRD countries)European UnionFaroe IslandsFijiFinlandFragile and conflict affected situationsFranceFrench PolynesiaGabonGambia, TheGeorgiaGermanyGhanaGreeceGrenadaGuatemalaGuineaGuinea-BissauGuyanaHaitiHeavily indebted poor countries (HIPC)High incomeHondurasHong Kong SAR, ChinaHungaryIBRD onlyIcelandIDA & IBRD totalIDA blendIDA onlyIDA totalIndiaIndonesiaIran, Islamic Rep.IraqIrelandIsraelItalyJamaicaJapanJordanKazakhstanKenyaKiribatiKorea, Rep.KosovoKuwaitKyrgyz RepublicLao PDRLate-demographic dividendLatin America & Caribbean Latin America & Caribbean (excluding high income)Latin America & the Caribbean (IDA & IBRD countries)LatviaLeast developed countries: UN classificationLebanonLesothoLiberiaLibyaLithuaniaLow & middle incomeLow incomeLower middle incomeLuxembourgMacao SAR, ChinaMacedonia, FYRMadagascarMalawiMalaysiaMaldivesMaliMaltaMauritaniaMauritiusMexicoMicronesia, Fed. Sts.Middle East & North AfricaMiddle East & North Africa (excluding high income)Middle East & North Africa (IDA & IBRD countries)Middle incomeMoldovaMongoliaMontenegroMoroccoMozambiqueMyanmarNamibiaNepalNetherlandsNew CaledoniaNew ZealandNicaraguaNigerNigeriaNorth AmericaNorwayOECD membersOmanOther small statesPacific island small statesPakistanPalauPanamaPapua New GuineaParaguayPeruPhilippinesPolandPortugalPost-demographic dividendPre-demographic dividendPuerto RicoQatarRomaniaRussian FederationRwandaSamoaSaudi ArabiaSenegalSerbiaSeychellesSierra LeoneSingaporeSlovak RepublicSloveniaSmall statesSolomon IslandsSomaliaSouth AfricaSouth AsiaSouth Asia (IDA & IBRD)South SudanSpainSri LankaSt. Kitts and NevisSt. LuciaSt. Vincent and the GrenadinesSub-Saharan Africa Sub-Saharan Africa (excluding high income)Sub-Saharan Africa (IDA & IBRD countries)SudanSurinameSwazilandSwedenSwitzerlandSyrian Arab RepublicTajikistanTanzaniaThailandTimor-LesteTogoTongaTrinidad and TobagoTunisiaTurkeyTurkmenistanUgandaUkraineUnited Arab EmiratesUnited KingdomUnited StatesUpper middle incomeUruguayUzbekistanVanuatuVenezuela, RBVietnamWest Bank and GazaWorldYemen, Rep.ZambiaZimbabwe Zeitlinie:
Diese Zeitleiste vorliegt die Graphik ab 1961 J. bis 2016 J. East Asia & Pacific. Die Angaben bis 1960 J. sind nicht vorhanden. Die Zahl aktueller Beobachtungen nach Daten: 56.
Die Quelle (Bezeichnung):
Kennzahlen der Weltentwicklung
Die Quelle (Einrichtung):
World Bank national accounts data, and OECD National Accounts data files.
Kategorien:
Economy & Growth
Es wurde aktualisiert:
23 Apr 2017 Jahr
Kennzahlen der Wertänderungen vom Jahr zum Jahr
im Durchschnitt:
5.765 Trln
Minimum:
151.669 Mlrd.
1 Jan 1961 Jahr
Maximum:
21.225 Trln
1 Jan 2015 Jahr
Zum Datum der Beobachtung
Wert
Absolute Veränderung
Die Veränderung bezüglich dem vorherigen Wert
1 Jan 1961 Jahr
151.669 Mlrd.
+151.669 Mlrd.
0.0%
1 Jan 1962 Jahr
153.173 Mlrd.
+1.504 Mlrd.
0.99%
1 Jan 1963 Jahr
154.26 Mlrd.
+1.087 Mlrd.
0.71%
1 Jan 1964 Jahr
173.381 Mlrd.
+19.121 Mlrd.
12.4%
1 Jan 1965 Jahr
198.369 Mlrd.
+24.988 Mlrd.
14.41%
1 Jan 1966 Jahr
222.991 Mlrd.
+24.621 Mlrd.
12.41%
1 Jan 1967 Jahr
249.586 Mlrd.
+26.596 Mlrd.
11.93%
1 Jan 1968 Jahr
272.378 Mlrd.
+22.791 Mlrd.
9.13%
1 Jan 1969 Jahr
300.745 Mlrd.
+28.367 Mlrd.
10.41%
1 Jan 1970 Jahr
345.096 Mlrd.
+44.351 Mlrd.
14.75%
1 Jan 1971 Jahr
404.801 Mlrd.
+59.706 Mlrd.
17.3%
1 Jan 1972 Jahr
444.962 Mlrd.
+40.16 Mlrd.
9.92%
1 Jan 1973 Jahr
550.58 Mlrd.
+105.618 Mlrd.
23.74%
1 Jan 1974 Jahr
732.566 Mlrd.
+181.986 Mlrd.
33.05%
1 Jan 1975 Jahr
856.203 Mlrd.
+123.636 Mlrd.
16.88%
1 Jan 1976 Jahr
933.443 Mlrd.
+77.241 Mlrd.
9.02%
1 Jan 1977 Jahr
1.015 Trln
+81.634 Mlrd.
8.75%
1 Jan 1978 Jahr
1.203 Trln
+187.615 Mlrd.
18.48%
1 Jan 1979 Jahr
1.52 Trln
+316.89 Mlrd.
26.35%
1 Jan 1980 Jahr
1.682 Trln
+162.052 Mlrd.
10.66%
1 Jan 1981 Jahr
1.81 Trln
+128.221 Mlrd.
7.62%
1 Jan 1982 Jahr
1.99 Trln
+179.867 Mlrd.
9.94%
1 Jan 1983 Jahr
1.949 Trln
-41.2 Mlrd.
-2.07%
1 Jan 1984 Jahr
2.053 Trln
+104.45 Mlrd.
5.36%
1 Jan 1985 Jahr
2.177 Trln
+124.421 Mlrd.
6.06%
1 Jan 1986 Jahr
2.307 Trln
+129.561 Mlrd.
5.95%
1 Jan 1987 Jahr
2.965 Trln
+658.262 Mlrd.
28.53%
1 Jan 1988 Jahr
3.466 Trln
+500.406 Mlrd.
16.88%
1 Jan 1989 Jahr
4.207 Trln
+741.323 Mlrd.
21.39%
1 Jan 1990 Jahr
4.437 Trln
+229.776 Mlrd.
5.46%
1 Jan 1991 Jahr
4.666 Trln
+229.121 Mlrd.
5.16%
1 Jan 1992 Jahr
5.227 Trln
+561.394 Mlrd.
12.03%
1 Jan 1993 Jahr
5.685 Trln
+457.952 Mlrd.
8.76%
1 Jan 1994 Jahr
6.39 Trln
+704.526 Mlrd.
12.39%
1 Jan 1995 Jahr
7.136 Trln
+745.812 Mlrd.
11.67%
1 Jan 1996 Jahr
8.118 Trln
+982.47 Mlrd.
13.77%
1 Jan 1997 Jahr
7.841 Trln
-276.781 Mlrd.
-3.41%
1 Jan 1998 Jahr
7.473 Trln
-368.032 Mlrd.
-4.69%
1 Jan 1999 Jahr
6.519 Trln
-954.228 Mlrd.
-12.77%
1 Jan 2000 Jahr
7.323 Trln
+804.153 Mlrd.
12.34%
1 Jan 2001 Jahr
7.946 Trln
+623.295 Mlrd.
8.51%
1 Jan 2002 Jahr
7.415 Trln
-531.834 Mlrd.
-6.69%
1 Jan 2003 Jahr
7.501 Trln
+86.139 Mlrd.
1.16%
1 Jan 2004 Jahr
8.232 Trln
+731.24 Mlrd.
9.75%
1 Jan 2005 Jahr
9.225 Trln
+993.34 Mlrd.
12.07%
1 Jan 2006 Jahr
9.785 Trln
+560.14 Mlrd.
6.07%
1 Jan 2007 Jahr
10.292 Trln
+506.82 Mlrd.
5.18%
1 Jan 2008 Jahr
11.453 Trln
+1.16 Trln
11.28%
1 Jan 2009 Jahr
13.451 Trln
+1.998 Trln
17.45%
1 Jan 2010 Jahr
13.864 Trln
+413.34 Mlrd.
3.07%
1 Jan 2011 Jahr
16.223 Trln
+2.359 Trln
17.01%
1 Jan 2012 Jahr
19.013 Trln
+2.79 Trln
17.2%
1 Jan 2013 Jahr
20.44 Trln
+1.427 Trln
7.51%
1 Jan 2014 Jahr
20.682 Trln
+241.652 Mlrd.
1.18%
1 Jan 2015 Jahr
21.225 Trln
+542.905 Mlrd.
2.63%
1 Jan 2016 Jahr
20.793 Trln
-431.631 Mlrd.
-2.03%
Bewertung der Länder gemäß mit laufender Statistik nach Jahren


Kommentare: