29
/de/
de
AIzaSyAYiBZKx7MnpbEhh9jyipgxe19OcubqV5w
April 1, 2024
54849
Post-demographic dividend
PST
false
2
1
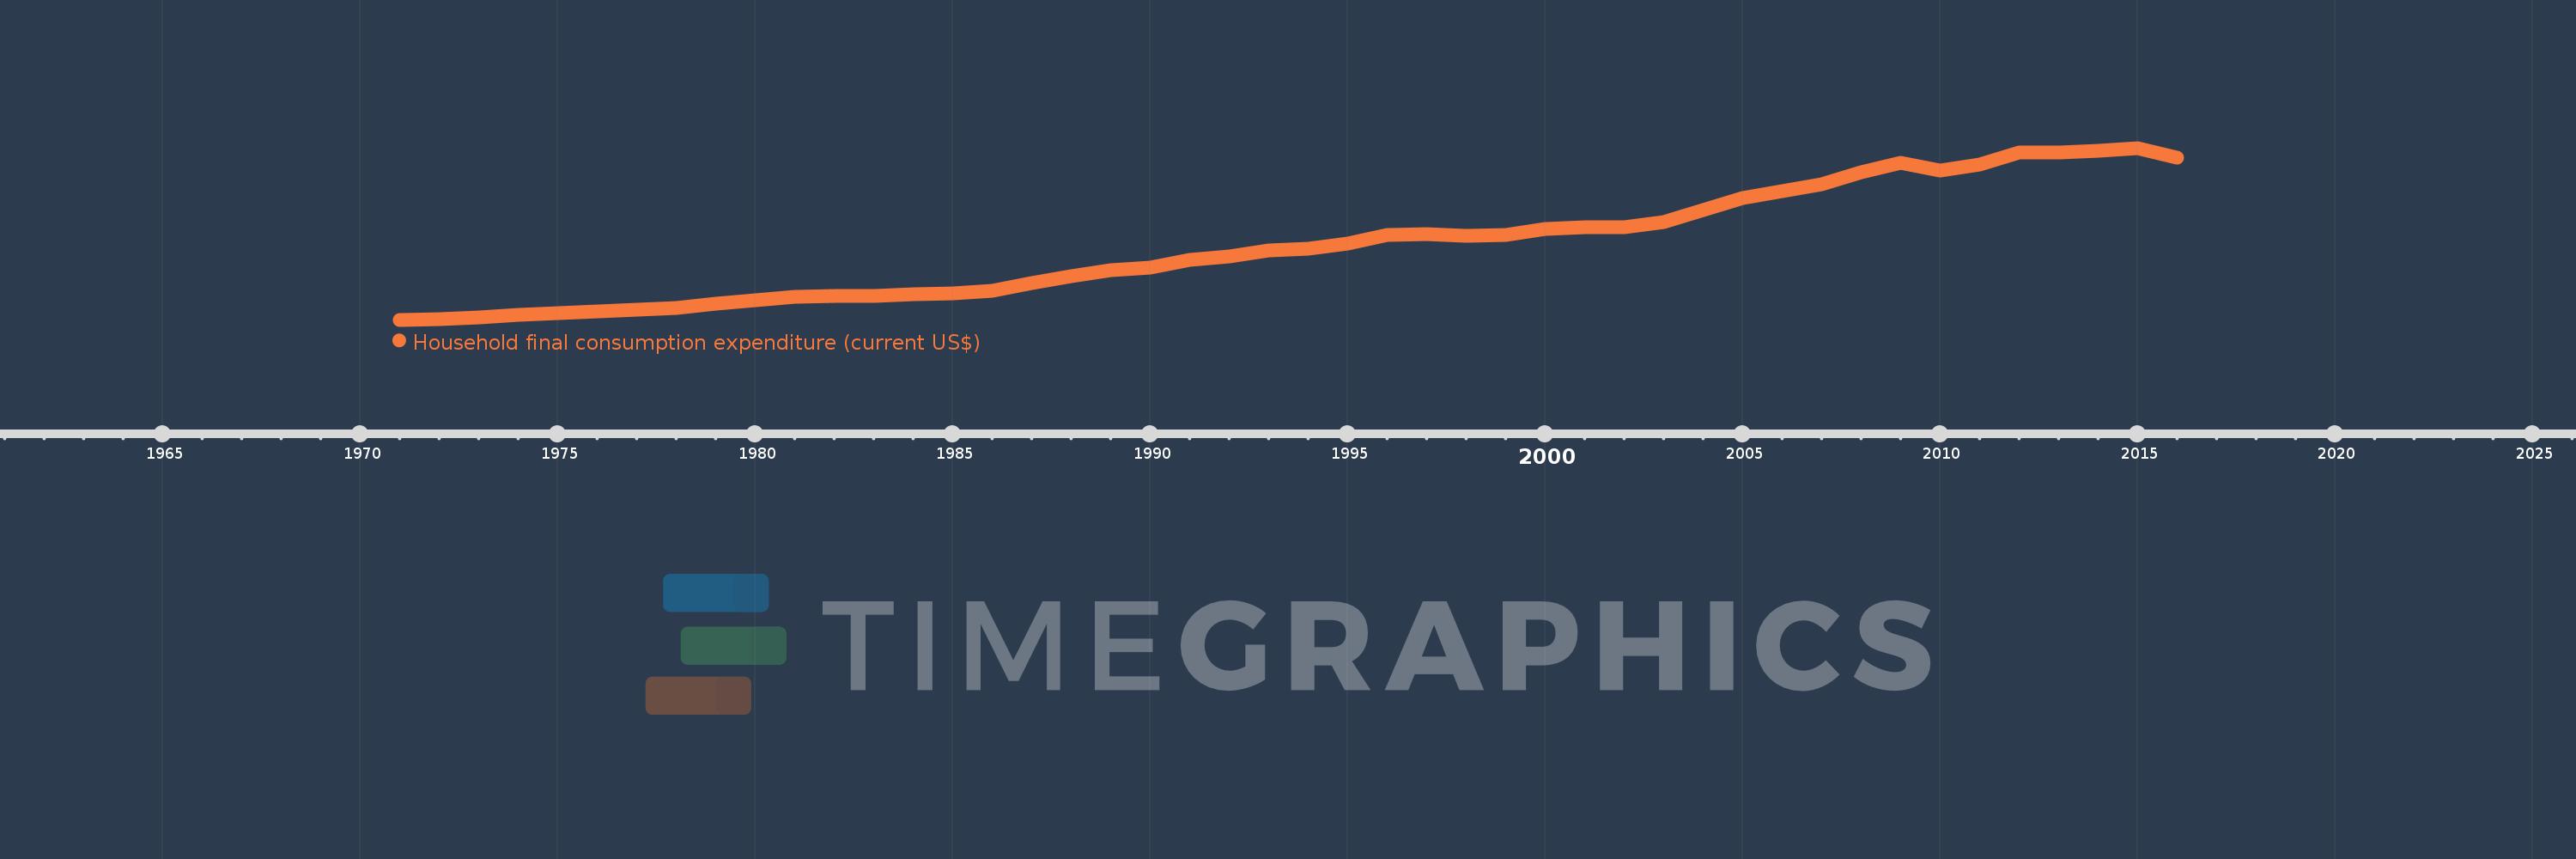
Household final consumption expenditure (current US$)
2016,2015,2014,2013,2012,2011,2010,2009,2008,2007,2006,2005,2004,2003,2002,2001,2000,1999,1998,1997,1996,1995,1994,1993,1992,1991,1990,1989,1988,1987,1986,1985,1984,1983,1982,1981,1980,1979,1978,1977,1976,1975,1974,1973,1972,1971
Diese Statistik in anderen Ländern:
AfghanistanAlbaniaAlgeriaAngolaAntigua and BarbudaArab WorldArgentinaArmeniaArubaAustraliaAustriaAzerbaijanBahamas, TheBahrainBangladeshBarbadosBelarusBelgiumBelizeBeninBermudaBhutanBoliviaBosnia and HerzegovinaBotswanaBrazilBrunei DarussalamBulgariaBurkina FasoBurundiCabo VerdeCambodiaCameroonCanadaCaribbean small statesCentral African RepublicCentral Europe and the BalticsChadChileChinaColombiaComorosCongo, Dem. Rep.Congo, Rep.Costa RicaCote d'IvoireCroatiaCubaCyprusCzech RepublicDenmarkDjiboutiDominicaDominican RepublicEarly-demographic dividendEast Asia & PacificEast Asia & Pacific (excluding high income)East Asia & Pacific (IDA & IBRD countries)EcuadorEgypt, Arab Rep.El SalvadorEquatorial GuineaEritreaEstoniaEthiopiaEuro areaEurope & Central AsiaEurope & Central Asia (excluding high income)Europe & Central Asia (IDA & IBRD countries)European UnionFaroe IslandsFijiFinlandFranceGabonGambia, TheGeorgiaGermanyGhanaGreeceGrenadaGuatemalaGuineaGuinea-BissauGuyanaHaitiHeavily indebted poor countries (HIPC)High incomeHondurasHong Kong SAR, ChinaHungaryIBRD onlyIcelandIDA & IBRD totalIDA blendIDA onlyIDA totalIndiaIndonesiaIran, Islamic Rep.IrelandIsraelItalyJamaicaJapanJordanKazakhstanKenyaKiribatiKorea, Rep.KosovoKuwaitKyrgyz RepublicLao PDRLate-demographic dividendLatin America & Caribbean Latin America & Caribbean (excluding high income)Latin America & the Caribbean (IDA & IBRD countries)LatviaLeast developed countries: UN classificationLebanonLesothoLiberiaLibyaLithuaniaLow & middle incomeLow incomeLower middle incomeLuxembourgMacao SAR, ChinaMacedonia, FYRMadagascarMalawiMalaysiaMaliMaltaMauritaniaMauritiusMexicoMicronesia, Fed. Sts.Middle East & North AfricaMiddle East & North Africa (excluding high income)Middle East & North Africa (IDA & IBRD countries)Middle incomeMoldovaMongoliaMontenegroMoroccoMozambiqueNamibiaNepalNetherlandsNew CaledoniaNew ZealandNicaraguaNigerNigeriaNorth AmericaNorwayOECD membersOmanOther small statesPakistanPanamaPapua New GuineaParaguayPeruPhilippinesPolandPortugalPost-demographic dividendPre-demographic dividendPuerto RicoQatarRomaniaRussian FederationRwandaSaudi ArabiaSenegalSerbiaSeychellesSierra LeoneSingaporeSlovak RepublicSloveniaSmall statesSolomon IslandsSomaliaSouth AfricaSouth AsiaSouth Asia (IDA & IBRD)South SudanSpainSri LankaSt. Kitts and NevisSt. LuciaSt. Vincent and the GrenadinesSub-Saharan Africa Sub-Saharan Africa (excluding high income)Sub-Saharan Africa (IDA & IBRD countries)SudanSurinameSwazilandSwedenSwitzerlandSyrian Arab RepublicTajikistanTanzaniaThailandTimor-LesteTogoTongaTrinidad and TobagoTunisiaTurkeyTurkmenistanUgandaUkraineUnited Arab EmiratesUnited KingdomUnited StatesUpper middle incomeUruguayUzbekistanVanuatuVenezuela, RBVietnamWest Bank and GazaWorldYemen, Rep.ZambiaZimbabwe Zeitlinie:
Diese Zeitleiste vorliegt die Graphik ab 1971 J. bis 2016 J. Post-demographic dividend. Die Angaben bis 1970 J. sind nicht vorhanden. Die Zahl aktueller Beobachtungen nach Daten: 46.
Die Quelle (Bezeichnung):
Kennzahlen der Weltentwicklung
Die Quelle (Einrichtung):
World Bank national accounts data, and OECD National Accounts data files.
Kategorien:
Economy & Growth
Es wurde aktualisiert:
23 Apr 2017 Jahr
Kennzahlen der Wertänderungen vom Jahr zum Jahr
im Durchschnitt:
12.951 Trln
Minimum:
1.345 Trln
1 Jan 1971 Jahr
Maximum:
28.252 Trln
1 Jan 2015 Jahr
Zum Datum der Beobachtung
Wert
Absolute Veränderung
Die Veränderung bezüglich dem vorherigen Wert
1 Jan 1971 Jahr
1.345 Trln
+1.345 Trln
0.0%
1 Jan 1972 Jahr
1.493 Trln
+147.936 Mlrd.
11.0%
1 Jan 1973 Jahr
1.729 Trln
+235.791 Mlrd.
15.79%
1 Jan 1974 Jahr
2.065 Trln
+335.47 Mlrd.
19.4%
1 Jan 1975 Jahr
2.318 Trln
+253.264 Mlrd.
12.27%
1 Jan 1976 Jahr
2.656 Trln
+338.305 Mlrd.
14.6%
1 Jan 1977 Jahr
2.875 Trln
+219.302 Mlrd.
8.26%
1 Jan 1978 Jahr
3.247 Trln
+371.945 Mlrd.
12.94%
1 Jan 1979 Jahr
3.869 Trln
+621.985 Mlrd.
19.15%
1 Jan 1980 Jahr
4.462 Trln
+592.891 Mlrd.
15.32%
1 Jan 1981 Jahr
4.984 Trln
+521.534 Mlrd.
11.69%
1 Jan 1982 Jahr
5.023 Trln
+39.491 Mlrd.
0.79%
1 Jan 1983 Jahr
5.081 Trln
+57.432 Mlrd.
1.14%
1 Jan 1984 Jahr
5.313 Trln
+232.601 Mlrd.
4.58%
1 Jan 1985 Jahr
5.492 Trln
+178.376 Mlrd.
3.36%
1 Jan 1986 Jahr
5.816 Trln
+324.052 Mlrd.
5.9%
1 Jan 1987 Jahr
7.071 Trln
+1.256 Trln
21.59%
1 Jan 1988 Jahr
8.193 Trln
+1.121 Trln
15.86%
1 Jan 1989 Jahr
9.149 Trln
+956.67 Mlrd.
11.68%
1 Jan 1990 Jahr
9.543 Trln
+393.802 Mlrd.
4.3%
1 Jan 1991 Jahr
10.72 Trln
+1.177 Trln
12.34%
1 Jan 1992 Jahr
11.315 Trln
+594.62 Mlrd.
5.55%
1 Jan 1993 Jahr
12.239 Trln
+923.861 Mlrd.
8.16%
1 Jan 1994 Jahr
12.416 Trln
+176.813 Mlrd.
1.44%
1 Jan 1995 Jahr
13.293 Trln
+877.22 Mlrd.
7.07%
1 Jan 1996 Jahr
14.595 Trln
+1.302 Trln
9.79%
1 Jan 1997 Jahr
14.739 Trln
+144.466 Mlrd.
0.99%
1 Jan 1998 Jahr
14.509 Trln
-230.532 Mlrd.
-1.56%
1 Jan 1999 Jahr
14.671 Trln
+162.215 Mlrd.
1.12%
1 Jan 2000 Jahr
15.501 Trln
+829.44 Mlrd.
5.65%
1 Jan 2001 Jahr
15.832 Trln
+331.039 Mlrd.
2.14%
1 Jan 2002 Jahr
15.87 Trln
+38.452 Mlrd.
0.24%
1 Jan 2003 Jahr
16.602 Trln
+731.672 Mlrd.
4.61%
1 Jan 2004 Jahr
18.549 Trln
+1.947 Trln
11.73%
1 Jan 2005 Jahr
20.456 Trln
+1.907 Trln
10.28%
1 Jan 2006 Jahr
21.527 Trln
+1.071 Trln
5.23%
1 Jan 2007 Jahr
22.558 Trln
+1.032 Trln
4.79%
1 Jan 2008 Jahr
24.434 Trln
+1.876 Trln
8.32%
1 Jan 2009 Jahr
25.866 Trln
+1.432 Trln
5.86%
1 Jan 2010 Jahr
24.762 Trln
-1.104 Trln
-4.27%
1 Jan 2011 Jahr
25.665 Trln
+902.333 Mlrd.
3.64%
1 Jan 2012 Jahr
27.551 Trln
+1.886 Trln
7.35%
1 Jan 2013 Jahr
27.591 Trln
+39.667 Mlrd.
0.14%
1 Jan 2014 Jahr
27.759 Trln
+168.336 Mlrd.
0.61%
1 Jan 2015 Jahr
28.252 Trln
+493.26 Mlrd.
1.78%
1 Jan 2016 Jahr
26.754 Trln
-1.498 Trln
-5.3%
Bewertung der Länder gemäß mit laufender Statistik nach Jahren


Kommentare: