29
/de/
de
AIzaSyAYiBZKx7MnpbEhh9jyipgxe19OcubqV5w
April 1, 2024
33501
European Union
EUU
false
2
1
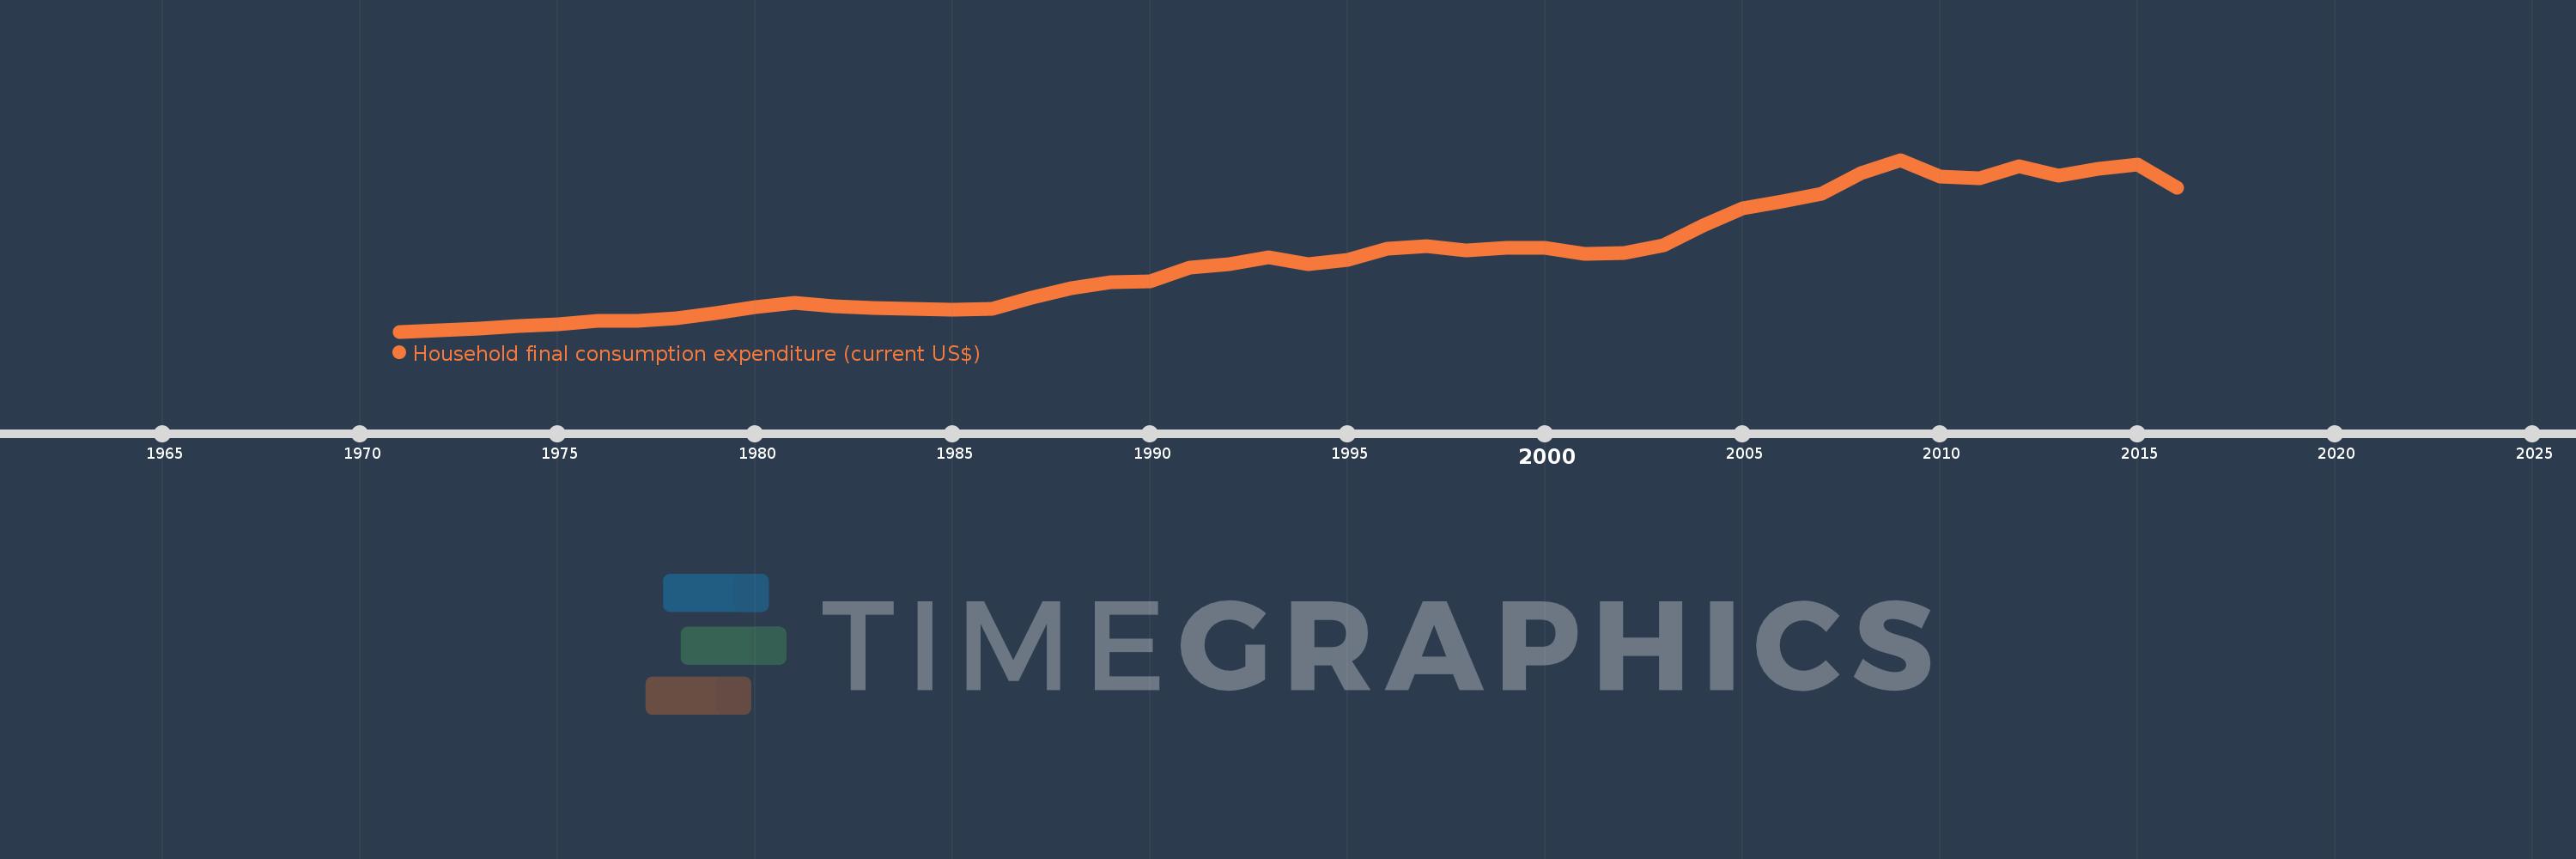
Household final consumption expenditure (current US$)
2016,2015,2014,2013,2012,2011,2010,2009,2008,2007,2006,2005,2004,2003,2002,2001,2000,1999,1998,1997,1996,1995,1994,1993,1992,1991,1990,1989,1988,1987,1986,1985,1984,1983,1982,1981,1980,1979,1978,1977,1976,1975,1974,1973,1972,1971
Diese Statistik in anderen Ländern:
AfghanistanAlbaniaAlgeriaAngolaAntigua and BarbudaArab WorldArgentinaArmeniaArubaAustraliaAustriaAzerbaijanBahamas, TheBahrainBangladeshBarbadosBelarusBelgiumBelizeBeninBermudaBhutanBoliviaBosnia and HerzegovinaBotswanaBrazilBrunei DarussalamBulgariaBurkina FasoBurundiCabo VerdeCambodiaCameroonCanadaCaribbean small statesCentral African RepublicCentral Europe and the BalticsChadChileChinaColombiaComorosCongo, Dem. Rep.Congo, Rep.Costa RicaCote d'IvoireCroatiaCubaCyprusCzech RepublicDenmarkDjiboutiDominicaDominican RepublicEarly-demographic dividendEast Asia & PacificEast Asia & Pacific (excluding high income)East Asia & Pacific (IDA & IBRD countries)EcuadorEgypt, Arab Rep.El SalvadorEquatorial GuineaEritreaEstoniaEthiopiaEuro areaEurope & Central AsiaEurope & Central Asia (excluding high income)Europe & Central Asia (IDA & IBRD countries)European UnionFaroe IslandsFijiFinlandFranceGabonGambia, TheGeorgiaGermanyGhanaGreeceGrenadaGuatemalaGuineaGuinea-BissauGuyanaHaitiHeavily indebted poor countries (HIPC)High incomeHondurasHong Kong SAR, ChinaHungaryIBRD onlyIcelandIDA & IBRD totalIDA blendIDA onlyIDA totalIndiaIndonesiaIran, Islamic Rep.IrelandIsraelItalyJamaicaJapanJordanKazakhstanKenyaKiribatiKorea, Rep.KosovoKuwaitKyrgyz RepublicLao PDRLate-demographic dividendLatin America & Caribbean Latin America & Caribbean (excluding high income)Latin America & the Caribbean (IDA & IBRD countries)LatviaLeast developed countries: UN classificationLebanonLesothoLiberiaLibyaLithuaniaLow & middle incomeLow incomeLower middle incomeLuxembourgMacao SAR, ChinaMacedonia, FYRMadagascarMalawiMalaysiaMaliMaltaMauritaniaMauritiusMexicoMicronesia, Fed. Sts.Middle East & North AfricaMiddle East & North Africa (excluding high income)Middle East & North Africa (IDA & IBRD countries)Middle incomeMoldovaMongoliaMontenegroMoroccoMozambiqueNamibiaNepalNetherlandsNew CaledoniaNew ZealandNicaraguaNigerNigeriaNorth AmericaNorwayOECD membersOmanOther small statesPakistanPanamaPapua New GuineaParaguayPeruPhilippinesPolandPortugalPost-demographic dividendPre-demographic dividendPuerto RicoQatarRomaniaRussian FederationRwandaSaudi ArabiaSenegalSerbiaSeychellesSierra LeoneSingaporeSlovak RepublicSloveniaSmall statesSolomon IslandsSomaliaSouth AfricaSouth AsiaSouth Asia (IDA & IBRD)South SudanSpainSri LankaSt. Kitts and NevisSt. LuciaSt. Vincent and the GrenadinesSub-Saharan Africa Sub-Saharan Africa (excluding high income)Sub-Saharan Africa (IDA & IBRD countries)SudanSurinameSwazilandSwedenSwitzerlandSyrian Arab RepublicTajikistanTanzaniaThailandTimor-LesteTogoTongaTrinidad and TobagoTunisiaTurkeyTurkmenistanUgandaUkraineUnited Arab EmiratesUnited KingdomUnited StatesUpper middle incomeUruguayUzbekistanVanuatuVenezuela, RBVietnamWest Bank and GazaWorldYemen, Rep.ZambiaZimbabwe Zeitlinie:
Diese Zeitleiste vorliegt die Graphik ab 1971 J. bis 2016 J. European Union. Die Angaben bis 1970 J. sind nicht vorhanden. Die Zahl aktueller Beobachtungen nach Daten: 46.
Die Quelle (Bezeichnung):
Kennzahlen der Weltentwicklung
Die Quelle (Einrichtung):
World Bank national accounts data, and OECD National Accounts data files.
Kategorien:
Economy & Growth
Es wurde aktualisiert:
23 Apr 2017 Jahr
Kennzahlen der Wertänderungen vom Jahr zum Jahr
im Durchschnitt:
4.885 Trln
Minimum:
491.2 Mlrd.
1 Jan 1971 Jahr
Maximum:
10.844 Trln
1 Jan 2009 Jahr
Zum Datum der Beobachtung
Wert
Absolute Veränderung
Die Veränderung bezüglich dem vorherigen Wert
1 Jan 1971 Jahr
491.2 Mlrd.
+491.2 Mlrd.
0.0%
1 Jan 1972 Jahr
556.063 Mlrd.
+64.863 Mlrd.
13.21%
1 Jan 1973 Jahr
666.184 Mlrd.
+110.121 Mlrd.
19.8%
1 Jan 1974 Jahr
837.301 Mlrd.
+171.117 Mlrd.
25.69%
1 Jan 1975 Jahr
944.575 Mlrd.
+107.274 Mlrd.
12.81%
1 Jan 1976 Jahr
1.123 Trln
+178.13 Mlrd.
18.86%
1 Jan 1977 Jahr
1.157 Trln
+34.367 Mlrd.
3.06%
1 Jan 1978 Jahr
1.31 Trln
+153.197 Mlrd.
13.24%
1 Jan 1979 Jahr
1.591 Trln
+280.249 Mlrd.
21.39%
1 Jan 1980 Jahr
1.953 Trln
+362.909 Mlrd.
22.82%
1 Jan 1981 Jahr
2.249 Trln
+295.906 Mlrd.
15.15%
1 Jan 1982 Jahr
2.012 Trln
-237.633 Mlrd.
-10.56%
1 Jan 1983 Jahr
1.939 Trln
-72.817 Mlrd.
-3.62%
1 Jan 1984 Jahr
1.874 Trln
-64.701 Mlrd.
-3.34%
1 Jan 1985 Jahr
1.789 Trln
-85.287 Mlrd.
-4.55%
1 Jan 1986 Jahr
1.847 Trln
+58.445 Mlrd.
3.27%
1 Jan 1987 Jahr
2.518 Trln
+670.317 Mlrd.
36.29%
1 Jan 1988 Jahr
3.125 Trln
+606.887 Mlrd.
24.11%
1 Jan 1989 Jahr
3.465 Trln
+340.907 Mlrd.
10.91%
1 Jan 1990 Jahr
3.532 Trln
+66.406 Mlrd.
1.92%
1 Jan 1991 Jahr
4.356 Trln
+824.373 Mlrd.
23.34%
1 Jan 1992 Jahr
4.542 Trln
+185.284 Mlrd.
4.25%
1 Jan 1993 Jahr
4.987 Trln
+445.212 Mlrd.
9.8%
1 Jan 1994 Jahr
4.569 Trln
-417.526 Mlrd.
-8.37%
1 Jan 1995 Jahr
4.835 Trln
+265.959 Mlrd.
5.82%
1 Jan 1996 Jahr
5.506 Trln
+670.41 Mlrd.
13.87%
1 Jan 1997 Jahr
5.66 Trln
+154.668 Mlrd.
2.81%
1 Jan 1998 Jahr
5.358 Trln
-302.183 Mlrd.
-5.34%
1 Jan 1999 Jahr
5.544 Trln
+185.75 Mlrd.
3.47%
1 Jan 2000 Jahr
5.557 Trln
+12.784 Mlrd.
0.23%
1 Jan 2001 Jahr
5.174 Trln
-382.786 Mlrd.
-6.89%
1 Jan 2002 Jahr
5.226 Trln
+52.464 Mlrd.
1.01%
1 Jan 2003 Jahr
5.672 Trln
+445.786 Mlrd.
8.53%
1 Jan 2004 Jahr
6.898 Trln
+1.226 Trln
21.62%
1 Jan 2005 Jahr
7.942 Trln
+1.044 Trln
15.13%
1 Jan 2006 Jahr
8.318 Trln
+375.948 Mlrd.
4.73%
1 Jan 2007 Jahr
8.791 Trln
+473.496 Mlrd.
5.69%
1 Jan 2008 Jahr
10.054 Trln
+1.263 Trln
14.37%
1 Jan 2009 Jahr
10.844 Trln
+789.054 Mlrd.
7.85%
1 Jan 2010 Jahr
9.822 Trln
-1.021 Trln
-9.42%
1 Jan 2011 Jahr
9.724 Trln
-98.791 Mlrd.
-1.01%
1 Jan 2012 Jahr
10.461 Trln
+736.858 Mlrd.
7.58%
1 Jan 2013 Jahr
9.91 Trln
-550.75 Mlrd.
-5.27%
1 Jan 2014 Jahr
10.276 Trln
+365.707 Mlrd.
3.69%
1 Jan 2015 Jahr
10.538 Trln
+262.375 Mlrd.
2.55%
1 Jan 2016 Jahr
9.186 Trln
-1.352 Trln
-12.83%
Bewertung der Länder gemäß mit laufender Statistik nach Jahren


Kommentare: