29
/de/
de
AIzaSyAYiBZKx7MnpbEhh9jyipgxe19OcubqV5w
April 1, 2024
29929
Euro area
EMU
false
2
1
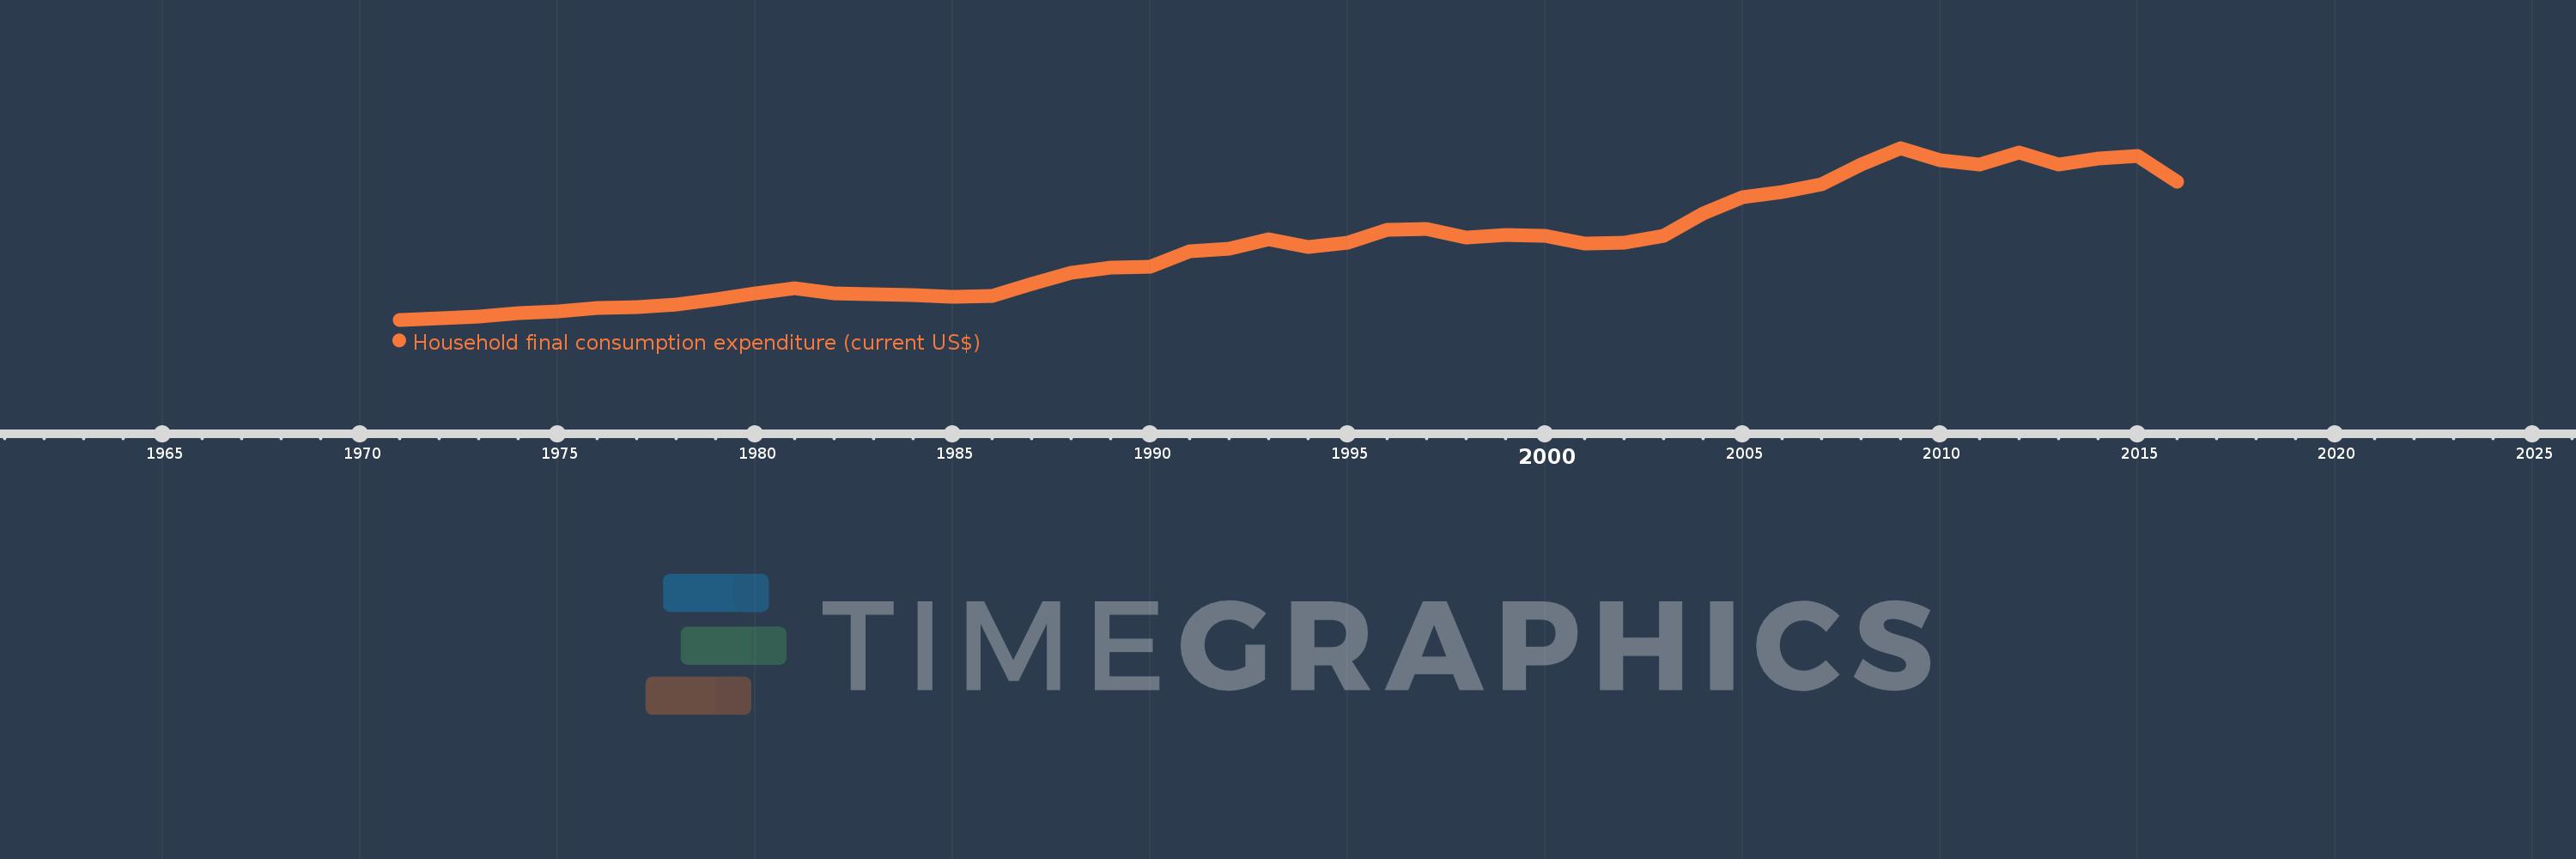
Household final consumption expenditure (current US$)
2016,2015,2014,2013,2012,2011,2010,2009,2008,2007,2006,2005,2004,2003,2002,2001,2000,1999,1998,1997,1996,1995,1994,1993,1992,1991,1990,1989,1988,1987,1986,1985,1984,1983,1982,1981,1980,1979,1978,1977,1976,1975,1974,1973,1972,1971
Diese Statistik in anderen Ländern:
AfghanistanAlbaniaAlgeriaAngolaAntigua and BarbudaArab WorldArgentinaArmeniaArubaAustraliaAustriaAzerbaijanBahamas, TheBahrainBangladeshBarbadosBelarusBelgiumBelizeBeninBermudaBhutanBoliviaBosnia and HerzegovinaBotswanaBrazilBrunei DarussalamBulgariaBurkina FasoBurundiCabo VerdeCambodiaCameroonCanadaCaribbean small statesCentral African RepublicCentral Europe and the BalticsChadChileChinaColombiaComorosCongo, Dem. Rep.Congo, Rep.Costa RicaCote d'IvoireCroatiaCubaCyprusCzech RepublicDenmarkDjiboutiDominicaDominican RepublicEarly-demographic dividendEast Asia & PacificEast Asia & Pacific (excluding high income)East Asia & Pacific (IDA & IBRD countries)EcuadorEgypt, Arab Rep.El SalvadorEquatorial GuineaEritreaEstoniaEthiopiaEuro areaEurope & Central AsiaEurope & Central Asia (excluding high income)Europe & Central Asia (IDA & IBRD countries)European UnionFaroe IslandsFijiFinlandFranceGabonGambia, TheGeorgiaGermanyGhanaGreeceGrenadaGuatemalaGuineaGuinea-BissauGuyanaHaitiHeavily indebted poor countries (HIPC)High incomeHondurasHong Kong SAR, ChinaHungaryIBRD onlyIcelandIDA & IBRD totalIDA blendIDA onlyIDA totalIndiaIndonesiaIran, Islamic Rep.IrelandIsraelItalyJamaicaJapanJordanKazakhstanKenyaKiribatiKorea, Rep.KosovoKuwaitKyrgyz RepublicLao PDRLate-demographic dividendLatin America & Caribbean Latin America & Caribbean (excluding high income)Latin America & the Caribbean (IDA & IBRD countries)LatviaLeast developed countries: UN classificationLebanonLesothoLiberiaLibyaLithuaniaLow & middle incomeLow incomeLower middle incomeLuxembourgMacao SAR, ChinaMacedonia, FYRMadagascarMalawiMalaysiaMaliMaltaMauritaniaMauritiusMexicoMicronesia, Fed. Sts.Middle East & North AfricaMiddle East & North Africa (excluding high income)Middle East & North Africa (IDA & IBRD countries)Middle incomeMoldovaMongoliaMontenegroMoroccoMozambiqueNamibiaNepalNetherlandsNew CaledoniaNew ZealandNicaraguaNigerNigeriaNorth AmericaNorwayOECD membersOmanOther small statesPakistanPanamaPapua New GuineaParaguayPeruPhilippinesPolandPortugalPost-demographic dividendPre-demographic dividendPuerto RicoQatarRomaniaRussian FederationRwandaSaudi ArabiaSenegalSerbiaSeychellesSierra LeoneSingaporeSlovak RepublicSloveniaSmall statesSolomon IslandsSomaliaSouth AfricaSouth AsiaSouth Asia (IDA & IBRD)South SudanSpainSri LankaSt. Kitts and NevisSt. LuciaSt. Vincent and the GrenadinesSub-Saharan Africa Sub-Saharan Africa (excluding high income)Sub-Saharan Africa (IDA & IBRD countries)SudanSurinameSwazilandSwedenSwitzerlandSyrian Arab RepublicTajikistanTanzaniaThailandTimor-LesteTogoTongaTrinidad and TobagoTunisiaTurkeyTurkmenistanUgandaUkraineUnited Arab EmiratesUnited KingdomUnited StatesUpper middle incomeUruguayUzbekistanVanuatuVenezuela, RBVietnamWest Bank and GazaWorldYemen, Rep.ZambiaZimbabwe Zeitlinie:
Diese Zeitleiste vorliegt die Graphik ab 1971 J. bis 2016 J. Euro area. Die Angaben bis 1970 J. sind nicht vorhanden. Die Zahl aktueller Beobachtungen nach Daten: 46.
Die Quelle (Bezeichnung):
Kennzahlen der Weltentwicklung
Die Quelle (Einrichtung):
World Bank national accounts data, and OECD National Accounts data files.
Kategorien:
Economy & Growth
Es wurde aktualisiert:
23 Apr 2017 Jahr
Kennzahlen der Wertänderungen vom Jahr zum Jahr
im Durchschnitt:
3.582 Trln
Minimum:
363.165 Mlrd.
1 Jan 1971 Jahr
Maximum:
7.833 Trln
1 Jan 2009 Jahr
Zum Datum der Beobachtung
Wert
Absolute Veränderung
Die Veränderung bezüglich dem vorherigen Wert
1 Jan 1971 Jahr
363.165 Mlrd.
+363.165 Mlrd.
0.0%
1 Jan 1972 Jahr
411.952 Mlrd.
+48.787 Mlrd.
13.43%
1 Jan 1973 Jahr
497.716 Mlrd.
+85.764 Mlrd.
20.82%
1 Jan 1974 Jahr
640.922 Mlrd.
+143.207 Mlrd.
28.77%
1 Jan 1975 Jahr
726.932 Mlrd.
+86.01 Mlrd.
13.42%
1 Jan 1976 Jahr
866.028 Mlrd.
+139.096 Mlrd.
19.13%
1 Jan 1977 Jahr
901.625 Mlrd.
+35.597 Mlrd.
4.11%
1 Jan 1978 Jahr
1.028 Trln
+126.316 Mlrd.
14.01%
1 Jan 1979 Jahr
1.245 Trln
+216.687 Mlrd.
21.08%
1 Jan 1980 Jahr
1.516 Trln
+271.531 Mlrd.
21.82%
1 Jan 1981 Jahr
1.718 Trln
+202.242 Mlrd.
13.34%
1 Jan 1982 Jahr
1.511 Trln
-207.669 Mlrd.
-12.08%
1 Jan 1983 Jahr
1.464 Trln
-46.723 Mlrd.
-3.09%
1 Jan 1984 Jahr
1.424 Trln
-39.688 Mlrd.
-2.71%
1 Jan 1985 Jahr
1.358 Trln
-66.045 Mlrd.
-4.64%
1 Jan 1986 Jahr
1.394 Trln
+35.502 Mlrd.
2.61%
1 Jan 1987 Jahr
1.931 Trln
+537.567 Mlrd.
38.57%
1 Jan 1988 Jahr
2.402 Trln
+470.502 Mlrd.
24.36%
1 Jan 1989 Jahr
2.612 Trln
+209.801 Mlrd.
8.73%
1 Jan 1990 Jahr
2.67 Trln
+58.534 Mlrd.
2.24%
1 Jan 1991 Jahr
3.33 Trln
+660.145 Mlrd.
24.72%
1 Jan 1992 Jahr
3.465 Trln
+134.966 Mlrd.
4.05%
1 Jan 1993 Jahr
3.846 Trln
+380.939 Mlrd.
10.99%
1 Jan 1994 Jahr
3.528 Trln
-318.472 Mlrd.
-8.28%
1 Jan 1995 Jahr
3.711 Trln
+183.204 Mlrd.
5.19%
1 Jan 1996 Jahr
4.255 Trln
+544.236 Mlrd.
14.67%
1 Jan 1997 Jahr
4.329 Trln
+73.784 Mlrd.
1.73%
1 Jan 1998 Jahr
3.939 Trln
-390.182 Mlrd.
-9.01%
1 Jan 1999 Jahr
4.037 Trln
+97.905 Mlrd.
2.49%
1 Jan 2000 Jahr
4.026 Trln
-11.179 Mlrd.
-0.28%
1 Jan 2001 Jahr
3.673 Trln
-352.181 Mlrd.
-8.75%
1 Jan 2002 Jahr
3.725 Trln
+51.232 Mlrd.
1.39%
1 Jan 2003 Jahr
4.028 Trln
+303.345 Mlrd.
8.14%
1 Jan 2004 Jahr
4.991 Trln
+962.998 Mlrd.
23.91%
1 Jan 2005 Jahr
5.698 Trln
+707.154 Mlrd.
14.17%
1 Jan 2006 Jahr
5.934 Trln
+235.689 Mlrd.
4.14%
1 Jan 2007 Jahr
6.248 Trln
+314.43 Mlrd.
5.3%
1 Jan 2008 Jahr
7.102 Trln
+854.022 Mlrd.
13.67%
1 Jan 2009 Jahr
7.833 Trln
+730.87 Mlrd.
10.29%
1 Jan 2010 Jahr
7.296 Trln
-537.054 Mlrd.
-6.86%
1 Jan 2011 Jahr
7.12 Trln
-176.004 Mlrd.
-2.41%
1 Jan 2012 Jahr
7.641 Trln
+521.152 Mlrd.
7.32%
1 Jan 2013 Jahr
7.113 Trln
-528.22 Mlrd.
-6.91%
1 Jan 2014 Jahr
7.383 Trln
+270.229 Mlrd.
3.8%
1 Jan 2015 Jahr
7.472 Trln
+88.513 Mlrd.
1.2%
1 Jan 2016 Jahr
6.367 Trln
-1.104 Trln
-14.78%
Bewertung der Länder gemäß mit laufender Statistik nach Jahren


Kommentare: