29
/de/
de
AIzaSyAYiBZKx7MnpbEhh9jyipgxe19OcubqV5w
April 1, 2024
53908
Pacific island small states
PSS
false
2
1
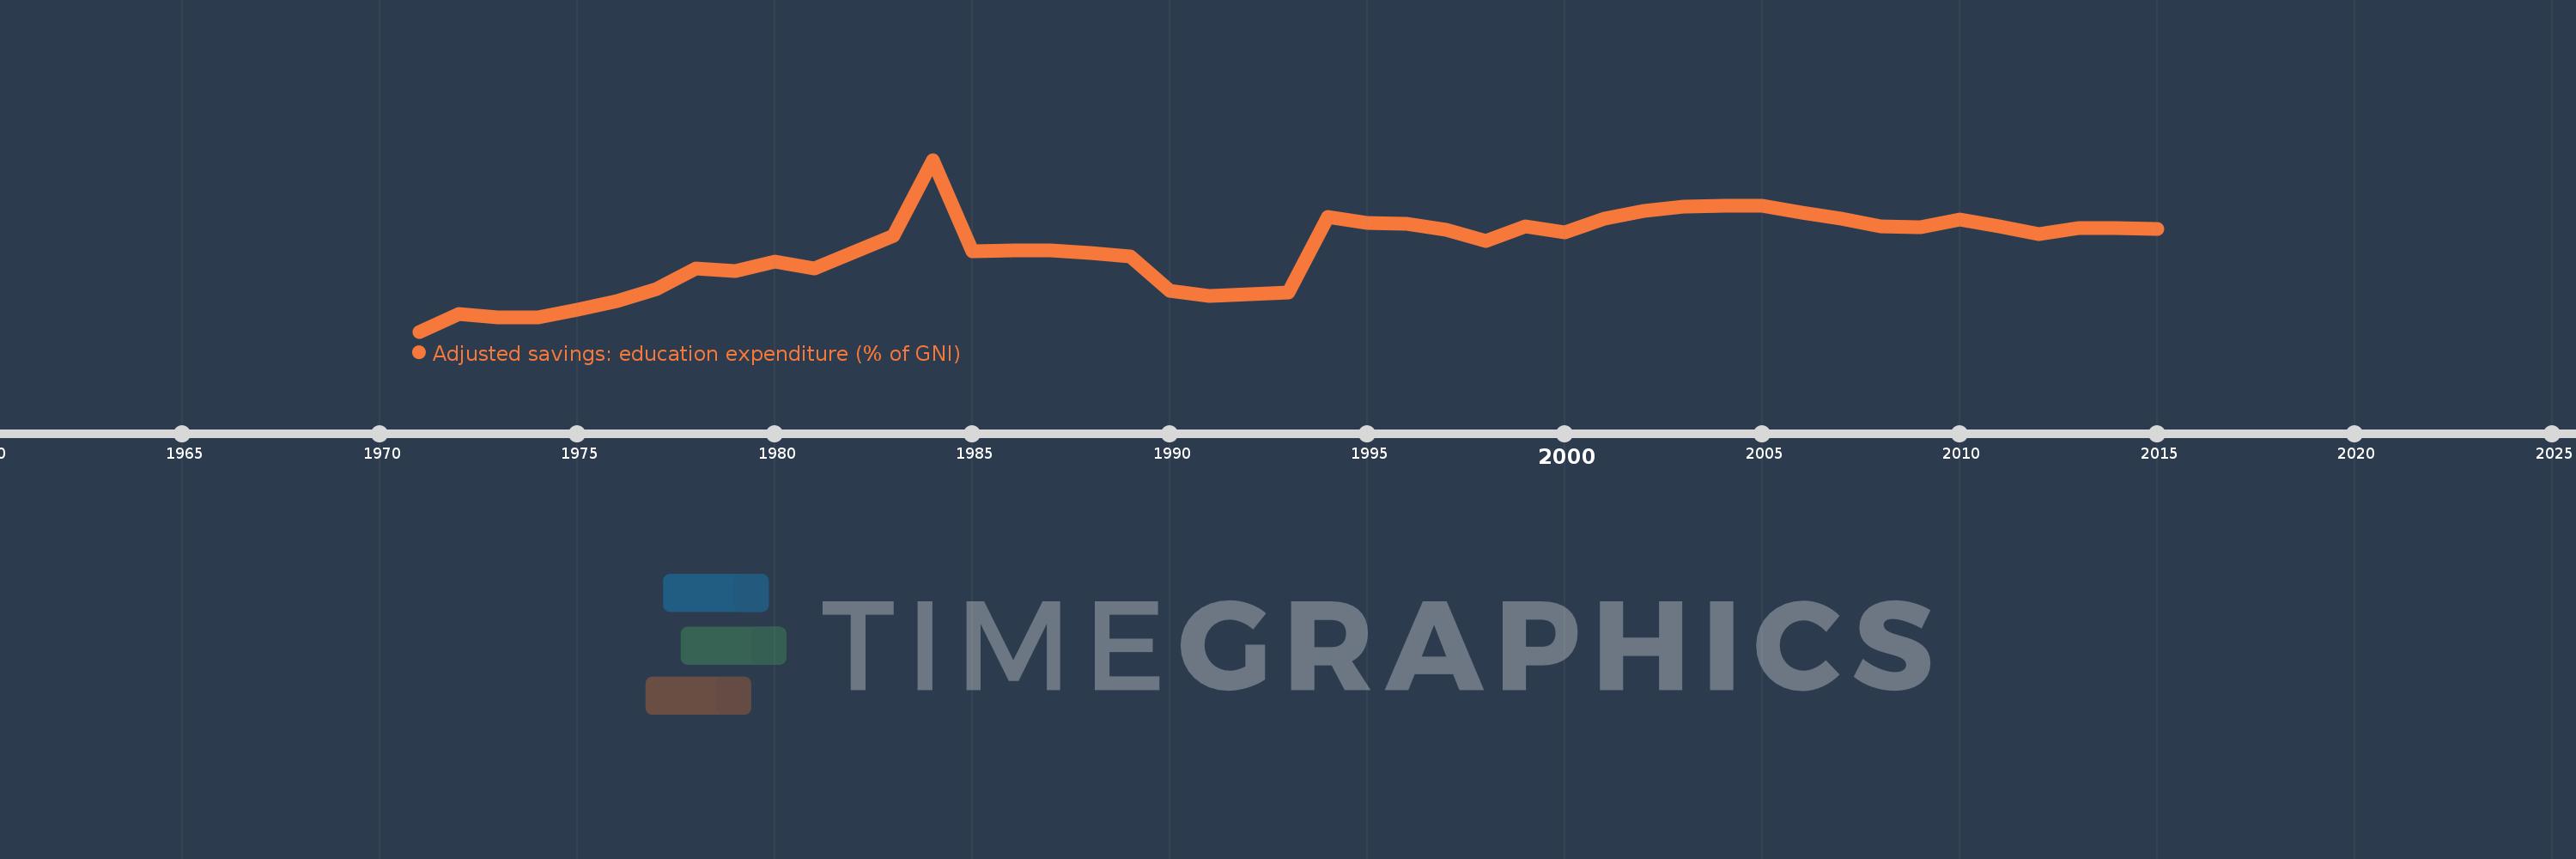
Adjusted savings: education expenditure (% of GNI)
2015,2014,2013,2012,2011,2010,2009,2008,2007,2006,2005,2004,2003,2002,2001,2000,1999,1998,1997,1996,1995,1994,1993,1992,1991,1990,1989,1988,1987,1986,1985,1984,1983,1982,1981,1980,1979,1978,1977,1976,1975,1974,1973,1972,1971
Diese Statistik in anderen Ländern:
AfghanistanAlbaniaAlgeriaAmerican SamoaAndorraAngolaAntigua and BarbudaArab WorldArgentinaArmeniaAustraliaAustriaAzerbaijanBahamas, TheBahrainBangladeshBarbadosBelarusBelgiumBelizeBeninBermudaBhutanBoliviaBotswanaBrazilBrunei DarussalamBulgariaBurkina FasoBurundiCabo VerdeCambodiaCameroonCanadaCaribbean small statesCentral African RepublicCentral Europe and the BalticsChadChileChinaColombiaComorosCongo, Dem. Rep.Congo, Rep.Costa RicaCote d'IvoireCroatiaCubaCyprusCzech RepublicDenmarkDjiboutiDominicaDominican RepublicEarly-demographic dividendEast Asia & PacificEast Asia & Pacific (excluding high income)East Asia & Pacific (IDA & IBRD countries)EcuadorEgypt, Arab Rep.El SalvadorEquatorial GuineaEritreaEstoniaEthiopiaEuro areaEurope & Central AsiaEurope & Central Asia (excluding high income)Europe & Central Asia (IDA & IBRD countries)European UnionFijiFinlandFragile and conflict affected situationsFranceFrench PolynesiaGabonGambia, TheGeorgiaGermanyGhanaGreeceGrenadaGuatemalaGuineaGuinea-BissauGuyanaHaitiHeavily indebted poor countries (HIPC)High incomeHondurasHong Kong SAR, ChinaHungaryIBRD onlyIcelandIDA & IBRD totalIDA blendIDA onlyIDA totalIndiaIndonesiaIran, Islamic Rep.IraqIrelandIsraelItalyJamaicaJapanJordanKazakhstanKenyaKiribatiKorea, Rep.KuwaitKyrgyz RepublicLao PDRLate-demographic dividendLatin America & Caribbean Latin America & Caribbean (excluding high income)Latin America & the Caribbean (IDA & IBRD countries)LatviaLeast developed countries: UN classificationLebanonLesothoLiberiaLibyaLiechtensteinLithuaniaLow & middle incomeLow incomeLower middle incomeLuxembourgMacao SAR, ChinaMacedonia, FYRMadagascarMalawiMalaysiaMaldivesMaliMaltaMarshall IslandsMauritaniaMauritiusMexicoMicronesia, Fed. Sts.Middle East & North AfricaMiddle East & North Africa (excluding high income)Middle East & North Africa (IDA & IBRD countries)Middle incomeMoldovaMonacoMongoliaMoroccoMozambiqueMyanmarNamibiaNepalNetherlandsNew CaledoniaNew ZealandNicaraguaNigerNigeriaNorth AmericaNorwayOECD membersOmanOther small statesPacific island small statesPakistanPanamaPapua New GuineaParaguayPeruPhilippinesPolandPortugalPost-demographic dividendPre-demographic dividendPuerto RicoQatarRomaniaRussian FederationRwandaSamoaSan MarinoSao Tome and PrincipeSaudi ArabiaSenegalSerbiaSeychellesSierra LeoneSingaporeSlovak RepublicSloveniaSmall statesSolomon IslandsSomaliaSouth AfricaSouth AsiaSouth Asia (IDA & IBRD)SpainSri LankaSt. Kitts and NevisSt. LuciaSt. Vincent and the GrenadinesSub-Saharan Africa Sub-Saharan Africa (excluding high income)Sub-Saharan Africa (IDA & IBRD countries)SudanSurinameSwazilandSwedenSwitzerlandSyrian Arab RepublicTajikistanTanzaniaThailandTimor-LesteTogoTongaTrinidad and TobagoTunisiaTurkeyTurkmenistanUgandaUkraineUnited KingdomUnited StatesUpper middle incomeUruguayUzbekistanVanuatuVenezuela, RBVietnamVirgin Islands (U.S.)WorldYemen, Rep.ZambiaZimbabwe Zeitlinie:
Diese Zeitleiste vorliegt die Graphik ab 1971 J. bis 2015 J. Pacific island small states. Die Angaben bis 1970 J. sind nicht vorhanden. Die Zahl aktueller Beobachtungen nach Daten: 45.
Die Quelle (Bezeichnung):
Kennzahlen der Weltentwicklung
Die Quelle (Einrichtung):
World Bank staff estimates using data from the United Nations Statistics Division's Statistical Yearbook, and the UNESCO Institute for Statistics online database.
Kategorien:
Economy & Growth, Environment
Es wurde aktualisiert:
23 Apr 2017 Jahr
Kennzahlen der Wertänderungen vom Jahr zum Jahr
Minimum:
3.7
1 Jan 1971 Jahr
Maximum:
7.559
1 Jan 1984 Jahr
Zum Datum der Beobachtung
Wert
Absolute Veränderung
Die Veränderung bezüglich dem vorherigen Wert
1 Jan 1971 Jahr
3.7
+3.7
0.0%
1 Jan 1972 Jahr
4.1
+0.4
10.81%
1 Jan 1973 Jahr
4.014
-0.086
-2.11%
1 Jan 1974 Jahr
4.014
0.0
0.0%
1 Jan 1975 Jahr
4.191
+0.177
4.41%
1 Jan 1976 Jahr
4.379
+0.189
4.5%
1 Jan 1977 Jahr
4.657
+0.278
6.34%
1 Jan 1978 Jahr
5.114
+0.457
9.82%
1 Jan 1979 Jahr
5.067
-0.048
-0.93%
1 Jan 1980 Jahr
5.269
+0.202
3.99%
1 Jan 1981 Jahr
5.126
-0.143
-2.72%
1 Jan 1982 Jahr
5.476
+0.351
6.84%
1 Jan 1983 Jahr
5.851
+0.375
6.84%
1 Jan 1984 Jahr
7.559
+1.708
29.2%
1 Jan 1985 Jahr
5.509
-2.05
-27.13%
1 Jan 1986 Jahr
5.515
+0.006
0.11%
1 Jan 1987 Jahr
5.526
+0.011
0.21%
1 Jan 1988 Jahr
5.469
-0.057
-1.04%
1 Jan 1989 Jahr
5.389
-0.08
-1.46%
1 Jan 1990 Jahr
4.609
-0.78
-14.47%
1 Jan 1991 Jahr
4.494
-0.115
-2.49%
1 Jan 1992 Jahr
4.541
+0.047
1.06%
1 Jan 1993 Jahr
4.57
+0.028
0.62%
1 Jan 1994 Jahr
6.268
+1.698
37.16%
1 Jan 1995 Jahr
6.133
-0.135
-2.15%
1 Jan 1996 Jahr
6.112
-0.021
-0.34%
1 Jan 1997 Jahr
5.989
-0.123
-2.02%
1 Jan 1998 Jahr
5.728
-0.261
-4.36%
1 Jan 1999 Jahr
6.056
+0.328
5.73%
1 Jan 2000 Jahr
5.935
-0.121
-2.0%
1 Jan 2001 Jahr
6.24
+0.305
5.15%
1 Jan 2002 Jahr
6.411
+0.171
2.74%
1 Jan 2003 Jahr
6.515
+0.104
1.62%
1 Jan 2004 Jahr
6.527
+0.012
0.19%
1 Jan 2005 Jahr
6.522
-0.005
-0.08%
1 Jan 2006 Jahr
6.368
-0.154
-2.36%
1 Jan 2007 Jahr
6.236
-0.133
-2.08%
1 Jan 2008 Jahr
6.067
-0.169
-2.7%
1 Jan 2009 Jahr
6.04
-0.027
-0.44%
1 Jan 2010 Jahr
6.221
+0.18
2.99%
1 Jan 2011 Jahr
6.06
-0.16
-2.58%
1 Jan 2012 Jahr
5.893
-0.167
-2.76%
1 Jan 2013 Jahr
6.024
+0.131
2.22%
1 Jan 2014 Jahr
6.03
+0.006
0.09%
1 Jan 2015 Jahr
6.015
-0.015
-0.24%
Bewertung der Länder gemäß mit laufender Statistik nach Jahren


Kommentare: