29
/de/
de
AIzaSyAYiBZKx7MnpbEhh9jyipgxe19OcubqV5w
April 1, 2024
27047
East Asia & Pacific
EAS
false
2
1
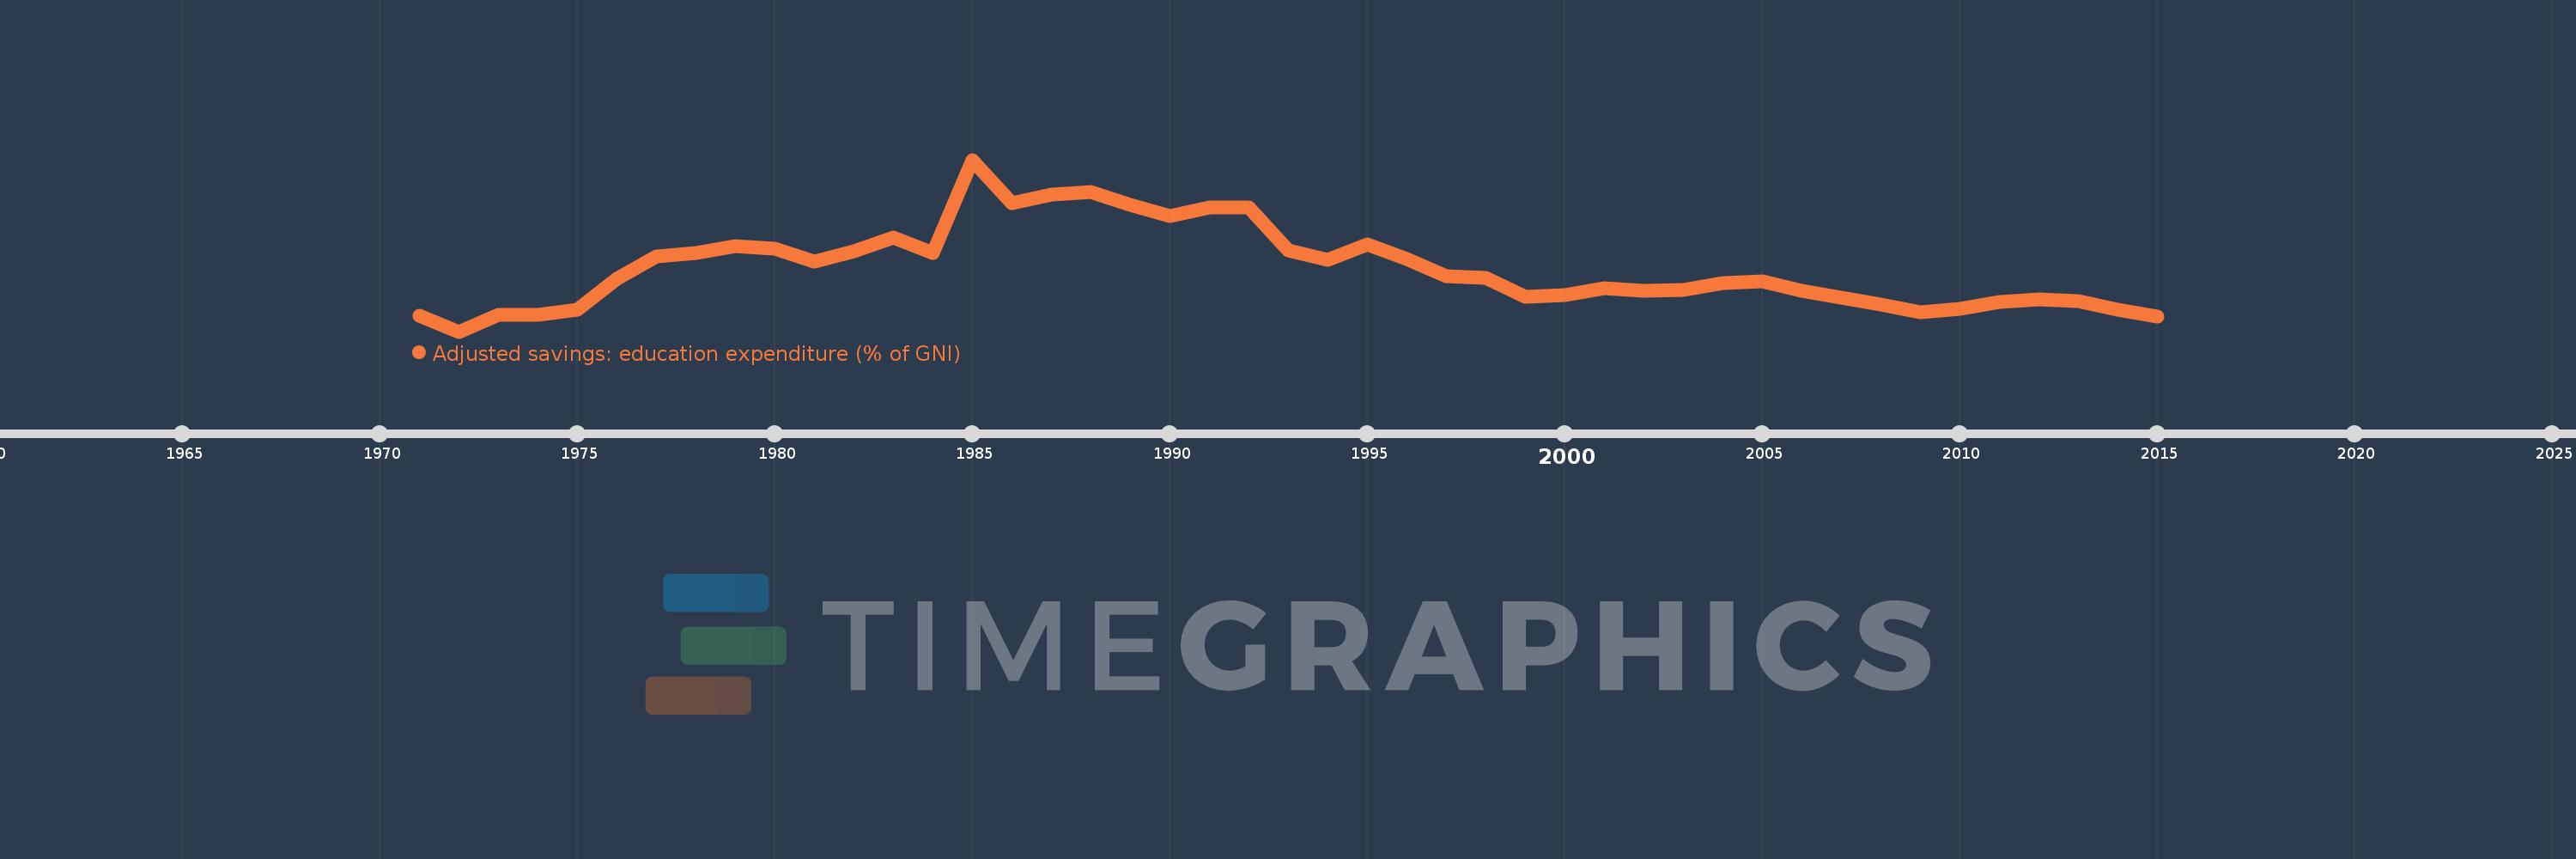
Adjusted savings: education expenditure (% of GNI)
2015,2014,2013,2012,2011,2010,2009,2008,2007,2006,2005,2004,2003,2002,2001,2000,1999,1998,1997,1996,1995,1994,1993,1992,1991,1990,1989,1988,1987,1986,1985,1984,1983,1982,1981,1980,1979,1978,1977,1976,1975,1974,1973,1972,1971
Diese Statistik in anderen Ländern:
AfghanistanAlbaniaAlgeriaAmerican SamoaAndorraAngolaAntigua and BarbudaArab WorldArgentinaArmeniaAustraliaAustriaAzerbaijanBahamas, TheBahrainBangladeshBarbadosBelarusBelgiumBelizeBeninBermudaBhutanBoliviaBotswanaBrazilBrunei DarussalamBulgariaBurkina FasoBurundiCabo VerdeCambodiaCameroonCanadaCaribbean small statesCentral African RepublicCentral Europe and the BalticsChadChileChinaColombiaComorosCongo, Dem. Rep.Congo, Rep.Costa RicaCote d'IvoireCroatiaCubaCyprusCzech RepublicDenmarkDjiboutiDominicaDominican RepublicEarly-demographic dividendEast Asia & PacificEast Asia & Pacific (excluding high income)East Asia & Pacific (IDA & IBRD countries)EcuadorEgypt, Arab Rep.El SalvadorEquatorial GuineaEritreaEstoniaEthiopiaEuro areaEurope & Central AsiaEurope & Central Asia (excluding high income)Europe & Central Asia (IDA & IBRD countries)European UnionFijiFinlandFragile and conflict affected situationsFranceFrench PolynesiaGabonGambia, TheGeorgiaGermanyGhanaGreeceGrenadaGuatemalaGuineaGuinea-BissauGuyanaHaitiHeavily indebted poor countries (HIPC)High incomeHondurasHong Kong SAR, ChinaHungaryIBRD onlyIcelandIDA & IBRD totalIDA blendIDA onlyIDA totalIndiaIndonesiaIran, Islamic Rep.IraqIrelandIsraelItalyJamaicaJapanJordanKazakhstanKenyaKiribatiKorea, Rep.KuwaitKyrgyz RepublicLao PDRLate-demographic dividendLatin America & Caribbean Latin America & Caribbean (excluding high income)Latin America & the Caribbean (IDA & IBRD countries)LatviaLeast developed countries: UN classificationLebanonLesothoLiberiaLibyaLiechtensteinLithuaniaLow & middle incomeLow incomeLower middle incomeLuxembourgMacao SAR, ChinaMacedonia, FYRMadagascarMalawiMalaysiaMaldivesMaliMaltaMarshall IslandsMauritaniaMauritiusMexicoMicronesia, Fed. Sts.Middle East & North AfricaMiddle East & North Africa (excluding high income)Middle East & North Africa (IDA & IBRD countries)Middle incomeMoldovaMonacoMongoliaMoroccoMozambiqueMyanmarNamibiaNepalNetherlandsNew CaledoniaNew ZealandNicaraguaNigerNigeriaNorth AmericaNorwayOECD membersOmanOther small statesPacific island small statesPakistanPanamaPapua New GuineaParaguayPeruPhilippinesPolandPortugalPost-demographic dividendPre-demographic dividendPuerto RicoQatarRomaniaRussian FederationRwandaSamoaSan MarinoSao Tome and PrincipeSaudi ArabiaSenegalSerbiaSeychellesSierra LeoneSingaporeSlovak RepublicSloveniaSmall statesSolomon IslandsSomaliaSouth AfricaSouth AsiaSouth Asia (IDA & IBRD)SpainSri LankaSt. Kitts and NevisSt. LuciaSt. Vincent and the GrenadinesSub-Saharan Africa Sub-Saharan Africa (excluding high income)Sub-Saharan Africa (IDA & IBRD countries)SudanSurinameSwazilandSwedenSwitzerlandSyrian Arab RepublicTajikistanTanzaniaThailandTimor-LesteTogoTongaTrinidad and TobagoTunisiaTurkeyTurkmenistanUgandaUkraineUnited KingdomUnited StatesUpper middle incomeUruguayUzbekistanVanuatuVenezuela, RBVietnamVirgin Islands (U.S.)WorldYemen, Rep.ZambiaZimbabwe Zeitlinie:
Diese Zeitleiste vorliegt die Graphik ab 1971 J. bis 2015 J. East Asia & Pacific. Die Angaben bis 1970 J. sind nicht vorhanden. Die Zahl aktueller Beobachtungen nach Daten: 45.
Die Quelle (Bezeichnung):
Kennzahlen der Weltentwicklung
Die Quelle (Einrichtung):
World Bank staff estimates using data from the United Nations Statistics Division's Statistical Yearbook, and the UNESCO Institute for Statistics online database.
Kategorien:
Economy & Growth, Environment
Es wurde aktualisiert:
23 Apr 2017 Jahr
Kennzahlen der Wertänderungen vom Jahr zum Jahr
Minimum:
2.652
1 Jan 1972 Jahr
Maximum:
4.107
1 Jan 1985 Jahr
Zum Datum der Beobachtung
Wert
Absolute Veränderung
Die Veränderung bezüglich dem vorherigen Wert
1 Jan 1971 Jahr
2.786
+2.786
0.0%
1 Jan 1972 Jahr
2.652
-0.134
-4.82%
1 Jan 1973 Jahr
2.794
+0.142
5.34%
1 Jan 1974 Jahr
2.792
-0.002
-0.07%
1 Jan 1975 Jahr
2.839
+0.048
1.71%
1 Jan 1976 Jahr
3.102
+0.263
9.26%
1 Jan 1977 Jahr
3.288
+0.186
6.0%
1 Jan 1978 Jahr
3.32
+0.032
0.97%
1 Jan 1979 Jahr
3.377
+0.057
1.71%
1 Jan 1980 Jahr
3.356
-0.022
-0.64%
1 Jan 1981 Jahr
3.247
-0.108
-3.23%
1 Jan 1982 Jahr
3.331
+0.084
2.58%
1 Jan 1983 Jahr
3.451
+0.12
3.6%
1 Jan 1984 Jahr
3.319
-0.132
-3.83%
1 Jan 1985 Jahr
4.107
+0.789
23.76%
1 Jan 1986 Jahr
3.743
-0.364
-8.86%
1 Jan 1987 Jahr
3.811
+0.067
1.8%
1 Jan 1988 Jahr
3.837
+0.026
0.69%
1 Jan 1989 Jahr
3.726
-0.111
-2.9%
1 Jan 1990 Jahr
3.627
-0.098
-2.64%
1 Jan 1991 Jahr
3.702
+0.074
2.05%
1 Jan 1992 Jahr
3.706
+0.005
0.13%
1 Jan 1993 Jahr
3.339
-0.368
-9.92%
1 Jan 1994 Jahr
3.262
-0.077
-2.31%
1 Jan 1995 Jahr
3.391
+0.129
3.95%
1 Jan 1996 Jahr
3.268
-0.122
-3.6%
1 Jan 1997 Jahr
3.12
-0.148
-4.54%
1 Jan 1998 Jahr
3.105
-0.016
-0.5%
1 Jan 1999 Jahr
2.947
-0.158
-5.08%
1 Jan 2000 Jahr
2.961
+0.014
0.47%
1 Jan 2001 Jahr
3.016
+0.056
1.88%
1 Jan 2002 Jahr
2.996
-0.02
-0.66%
1 Jan 2003 Jahr
3.006
+0.01
0.34%
1 Jan 2004 Jahr
3.064
+0.058
1.92%
1 Jan 2005 Jahr
3.079
+0.015
0.47%
1 Jan 2006 Jahr
2.999
-0.08
-2.61%
1 Jan 2007 Jahr
2.941
-0.058
-1.94%
1 Jan 2008 Jahr
2.878
-0.062
-2.12%
1 Jan 2009 Jahr
2.817
-0.061
-2.13%
1 Jan 2010 Jahr
2.845
+0.029
1.02%
1 Jan 2011 Jahr
2.903
+0.057
2.01%
1 Jan 2012 Jahr
2.927
+0.025
0.86%
1 Jan 2013 Jahr
2.913
-0.014
-0.49%
1 Jan 2014 Jahr
2.834
-0.078
-2.69%
1 Jan 2015 Jahr
2.779
-0.055
-1.96%
Bewertung der Länder gemäß mit laufender Statistik nach Jahren


Kommentare: