29
/de/
de
AIzaSyAYiBZKx7MnpbEhh9jyipgxe19OcubqV5w
April 1, 2024
36330
IBRD only
IBD
false
2
1
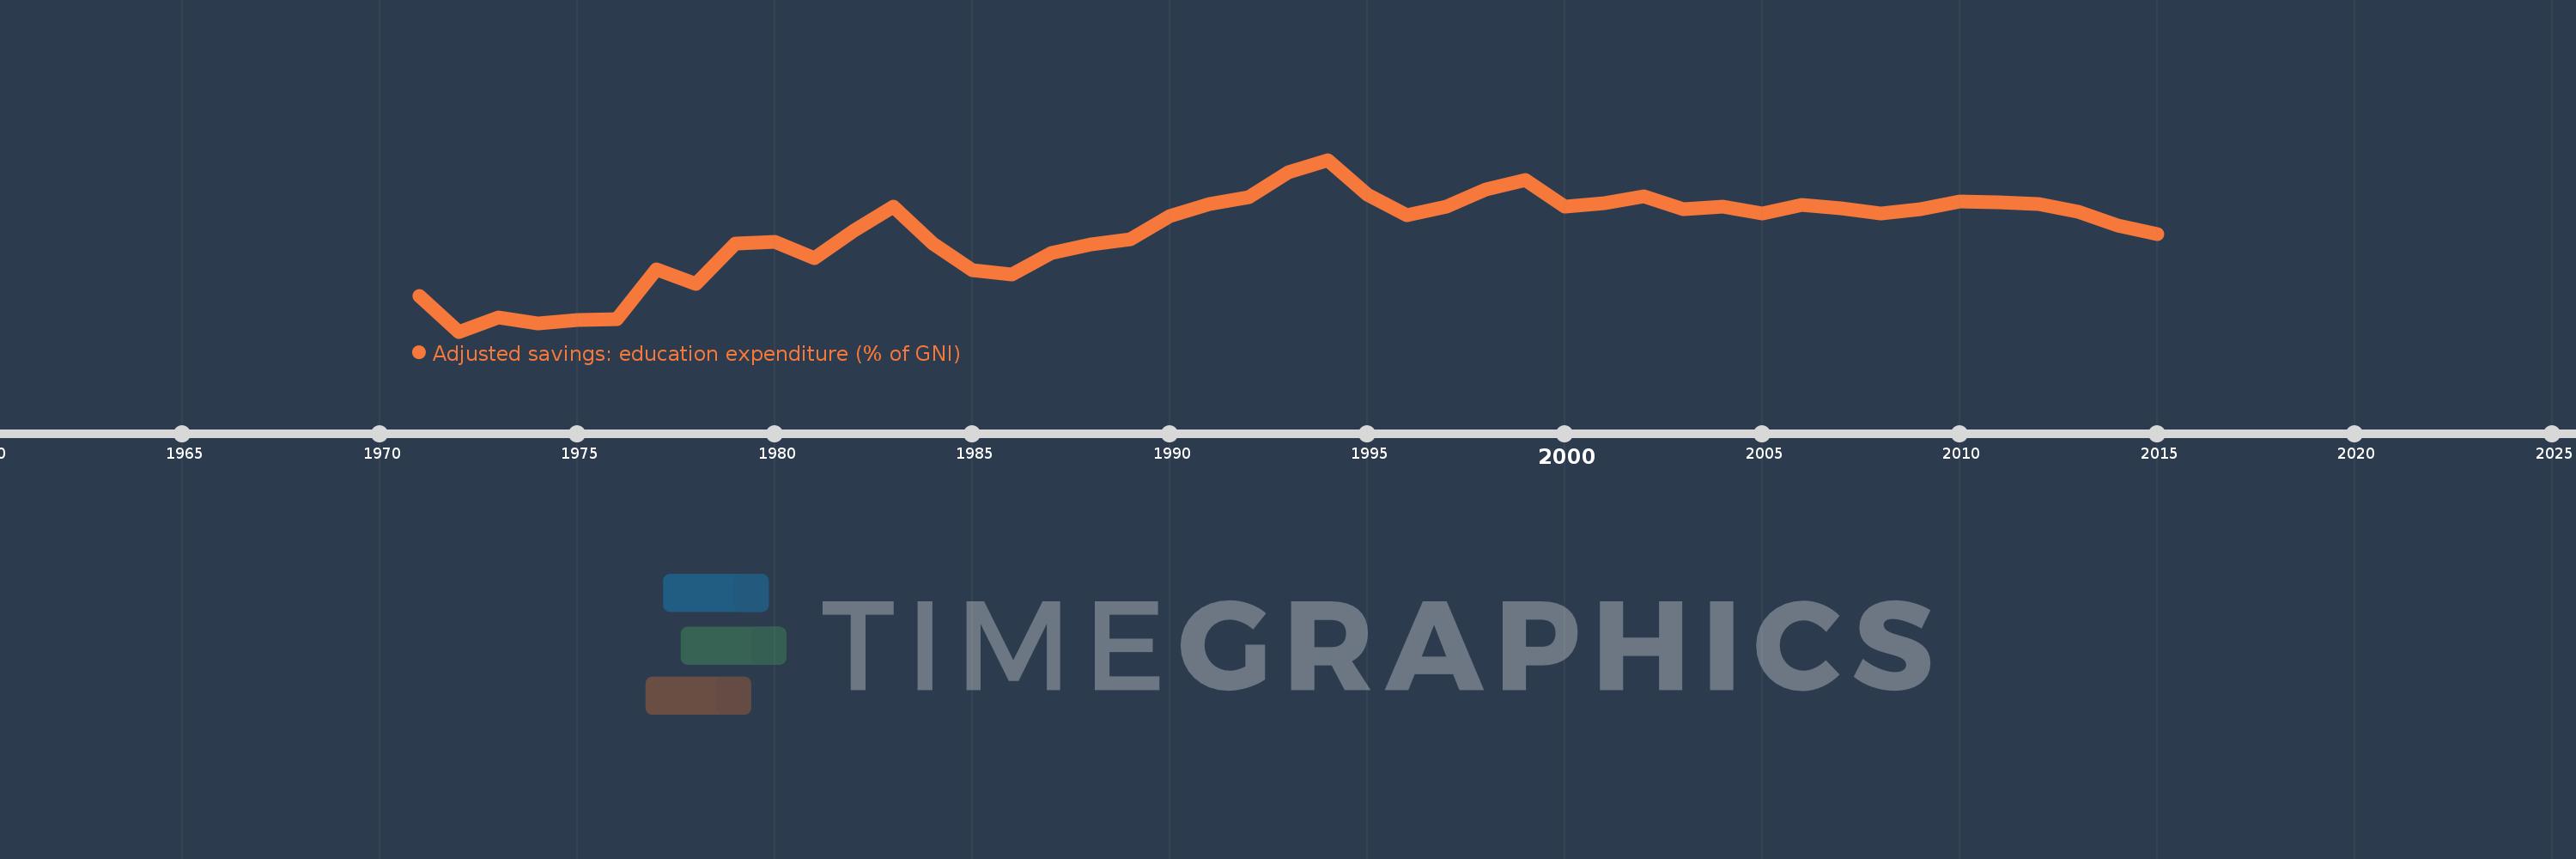
Adjusted savings: education expenditure (% of GNI)
2015,2014,2013,2012,2011,2010,2009,2008,2007,2006,2005,2004,2003,2002,2001,2000,1999,1998,1997,1996,1995,1994,1993,1992,1991,1990,1989,1988,1987,1986,1985,1984,1983,1982,1981,1980,1979,1978,1977,1976,1975,1974,1973,1972,1971
Diese Statistik in anderen Ländern:
AfghanistanAlbaniaAlgeriaAmerican SamoaAndorraAngolaAntigua and BarbudaArab WorldArgentinaArmeniaAustraliaAustriaAzerbaijanBahamas, TheBahrainBangladeshBarbadosBelarusBelgiumBelizeBeninBermudaBhutanBoliviaBotswanaBrazilBrunei DarussalamBulgariaBurkina FasoBurundiCabo VerdeCambodiaCameroonCanadaCaribbean small statesCentral African RepublicCentral Europe and the BalticsChadChileChinaColombiaComorosCongo, Dem. Rep.Congo, Rep.Costa RicaCote d'IvoireCroatiaCubaCyprusCzech RepublicDenmarkDjiboutiDominicaDominican RepublicEarly-demographic dividendEast Asia & PacificEast Asia & Pacific (excluding high income)East Asia & Pacific (IDA & IBRD countries)EcuadorEgypt, Arab Rep.El SalvadorEquatorial GuineaEritreaEstoniaEthiopiaEuro areaEurope & Central AsiaEurope & Central Asia (excluding high income)Europe & Central Asia (IDA & IBRD countries)European UnionFijiFinlandFragile and conflict affected situationsFranceFrench PolynesiaGabonGambia, TheGeorgiaGermanyGhanaGreeceGrenadaGuatemalaGuineaGuinea-BissauGuyanaHaitiHeavily indebted poor countries (HIPC)High incomeHondurasHong Kong SAR, ChinaHungaryIBRD onlyIcelandIDA & IBRD totalIDA blendIDA onlyIDA totalIndiaIndonesiaIran, Islamic Rep.IraqIrelandIsraelItalyJamaicaJapanJordanKazakhstanKenyaKiribatiKorea, Rep.KuwaitKyrgyz RepublicLao PDRLate-demographic dividendLatin America & Caribbean Latin America & Caribbean (excluding high income)Latin America & the Caribbean (IDA & IBRD countries)LatviaLeast developed countries: UN classificationLebanonLesothoLiberiaLibyaLiechtensteinLithuaniaLow & middle incomeLow incomeLower middle incomeLuxembourgMacao SAR, ChinaMacedonia, FYRMadagascarMalawiMalaysiaMaldivesMaliMaltaMarshall IslandsMauritaniaMauritiusMexicoMicronesia, Fed. Sts.Middle East & North AfricaMiddle East & North Africa (excluding high income)Middle East & North Africa (IDA & IBRD countries)Middle incomeMoldovaMonacoMongoliaMoroccoMozambiqueMyanmarNamibiaNepalNetherlandsNew CaledoniaNew ZealandNicaraguaNigerNigeriaNorth AmericaNorwayOECD membersOmanOther small statesPacific island small statesPakistanPanamaPapua New GuineaParaguayPeruPhilippinesPolandPortugalPost-demographic dividendPre-demographic dividendPuerto RicoQatarRomaniaRussian FederationRwandaSamoaSan MarinoSao Tome and PrincipeSaudi ArabiaSenegalSerbiaSeychellesSierra LeoneSingaporeSlovak RepublicSloveniaSmall statesSolomon IslandsSomaliaSouth AfricaSouth AsiaSouth Asia (IDA & IBRD)SpainSri LankaSt. Kitts and NevisSt. LuciaSt. Vincent and the GrenadinesSub-Saharan Africa Sub-Saharan Africa (excluding high income)Sub-Saharan Africa (IDA & IBRD countries)SudanSurinameSwazilandSwedenSwitzerlandSyrian Arab RepublicTajikistanTanzaniaThailandTimor-LesteTogoTongaTrinidad and TobagoTunisiaTurkeyTurkmenistanUgandaUkraineUnited KingdomUnited StatesUpper middle incomeUruguayUzbekistanVanuatuVenezuela, RBVietnamVirgin Islands (U.S.)WorldYemen, Rep.ZambiaZimbabwe Zeitlinie:
Diese Zeitleiste vorliegt die Graphik ab 1971 J. bis 2015 J. IBRD only. Die Angaben bis 1970 J. sind nicht vorhanden. Die Zahl aktueller Beobachtungen nach Daten: 45.
Die Quelle (Bezeichnung):
Kennzahlen der Weltentwicklung
Die Quelle (Einrichtung):
World Bank staff estimates using data from the United Nations Statistics Division's Statistical Yearbook, and the UNESCO Institute for Statistics online database.
Kategorien:
Economy & Growth, Environment
Es wurde aktualisiert:
23 Apr 2017 Jahr
Kennzahlen der Wertänderungen vom Jahr zum Jahr
Minimum:
2.477
1 Jan 1972 Jahr
Maximum:
3.7
1 Jan 1994 Jahr
Zum Datum der Beobachtung
Wert
Absolute Veränderung
Die Veränderung bezüglich dem vorherigen Wert
1 Jan 1971 Jahr
2.731
+2.731
0.0%
1 Jan 1972 Jahr
2.477
-0.253
-9.28%
1 Jan 1973 Jahr
2.577
+0.099
4.01%
1 Jan 1974 Jahr
2.537
-0.039
-1.52%
1 Jan 1975 Jahr
2.561
+0.023
0.91%
1 Jan 1976 Jahr
2.566
+0.006
0.23%
1 Jan 1977 Jahr
2.923
+0.356
13.88%
1 Jan 1978 Jahr
2.817
-0.105
-3.61%
1 Jan 1979 Jahr
3.104
+0.287
10.19%
1 Jan 1980 Jahr
3.113
+0.009
0.28%
1 Jan 1981 Jahr
2.997
-0.116
-3.72%
1 Jan 1982 Jahr
3.198
+0.201
6.7%
1 Jan 1983 Jahr
3.365
+0.167
5.23%
1 Jan 1984 Jahr
3.101
-0.264
-7.85%
1 Jan 1985 Jahr
2.917
-0.184
-5.92%
1 Jan 1986 Jahr
2.882
-0.035
-1.19%
1 Jan 1987 Jahr
3.037
+0.155
5.37%
1 Jan 1988 Jahr
3.099
+0.062
2.05%
1 Jan 1989 Jahr
3.137
+0.038
1.23%
1 Jan 1990 Jahr
3.301
+0.163
5.21%
1 Jan 1991 Jahr
3.385
+0.084
2.55%
1 Jan 1992 Jahr
3.434
+0.049
1.45%
1 Jan 1993 Jahr
3.61
+0.176
5.14%
1 Jan 1994 Jahr
3.7
+0.089
2.48%
1 Jan 1995 Jahr
3.452
-0.248
-6.7%
1 Jan 1996 Jahr
3.306
-0.146
-4.22%
1 Jan 1997 Jahr
3.364
+0.058
1.77%
1 Jan 1998 Jahr
3.488
+0.123
3.66%
1 Jan 1999 Jahr
3.559
+0.071
2.04%
1 Jan 2000 Jahr
3.369
-0.19
-5.33%
1 Jan 2001 Jahr
3.394
+0.025
0.73%
1 Jan 2002 Jahr
3.438
+0.044
1.3%
1 Jan 2003 Jahr
3.346
-0.092
-2.68%
1 Jan 2004 Jahr
3.367
+0.021
0.63%
1 Jan 2005 Jahr
3.317
-0.05
-1.49%
1 Jan 2006 Jahr
3.381
+0.065
1.95%
1 Jan 2007 Jahr
3.357
-0.024
-0.72%
1 Jan 2008 Jahr
3.318
-0.039
-1.17%
1 Jan 2009 Jahr
3.35
+0.032
0.95%
1 Jan 2010 Jahr
3.402
+0.052
1.55%
1 Jan 2011 Jahr
3.395
-0.006
-0.18%
1 Jan 2012 Jahr
3.383
-0.012
-0.35%
1 Jan 2013 Jahr
3.328
-0.055
-1.63%
1 Jan 2014 Jahr
3.232
-0.096
-2.9%
1 Jan 2015 Jahr
3.171
-0.061
-1.88%
Bewertung der Länder gemäß mit laufender Statistik nach Jahren


Kommentare: