29
/de/
de
AIzaSyAYiBZKx7MnpbEhh9jyipgxe19OcubqV5w
April 1, 2024
51756
North America
NAC
false
2
1
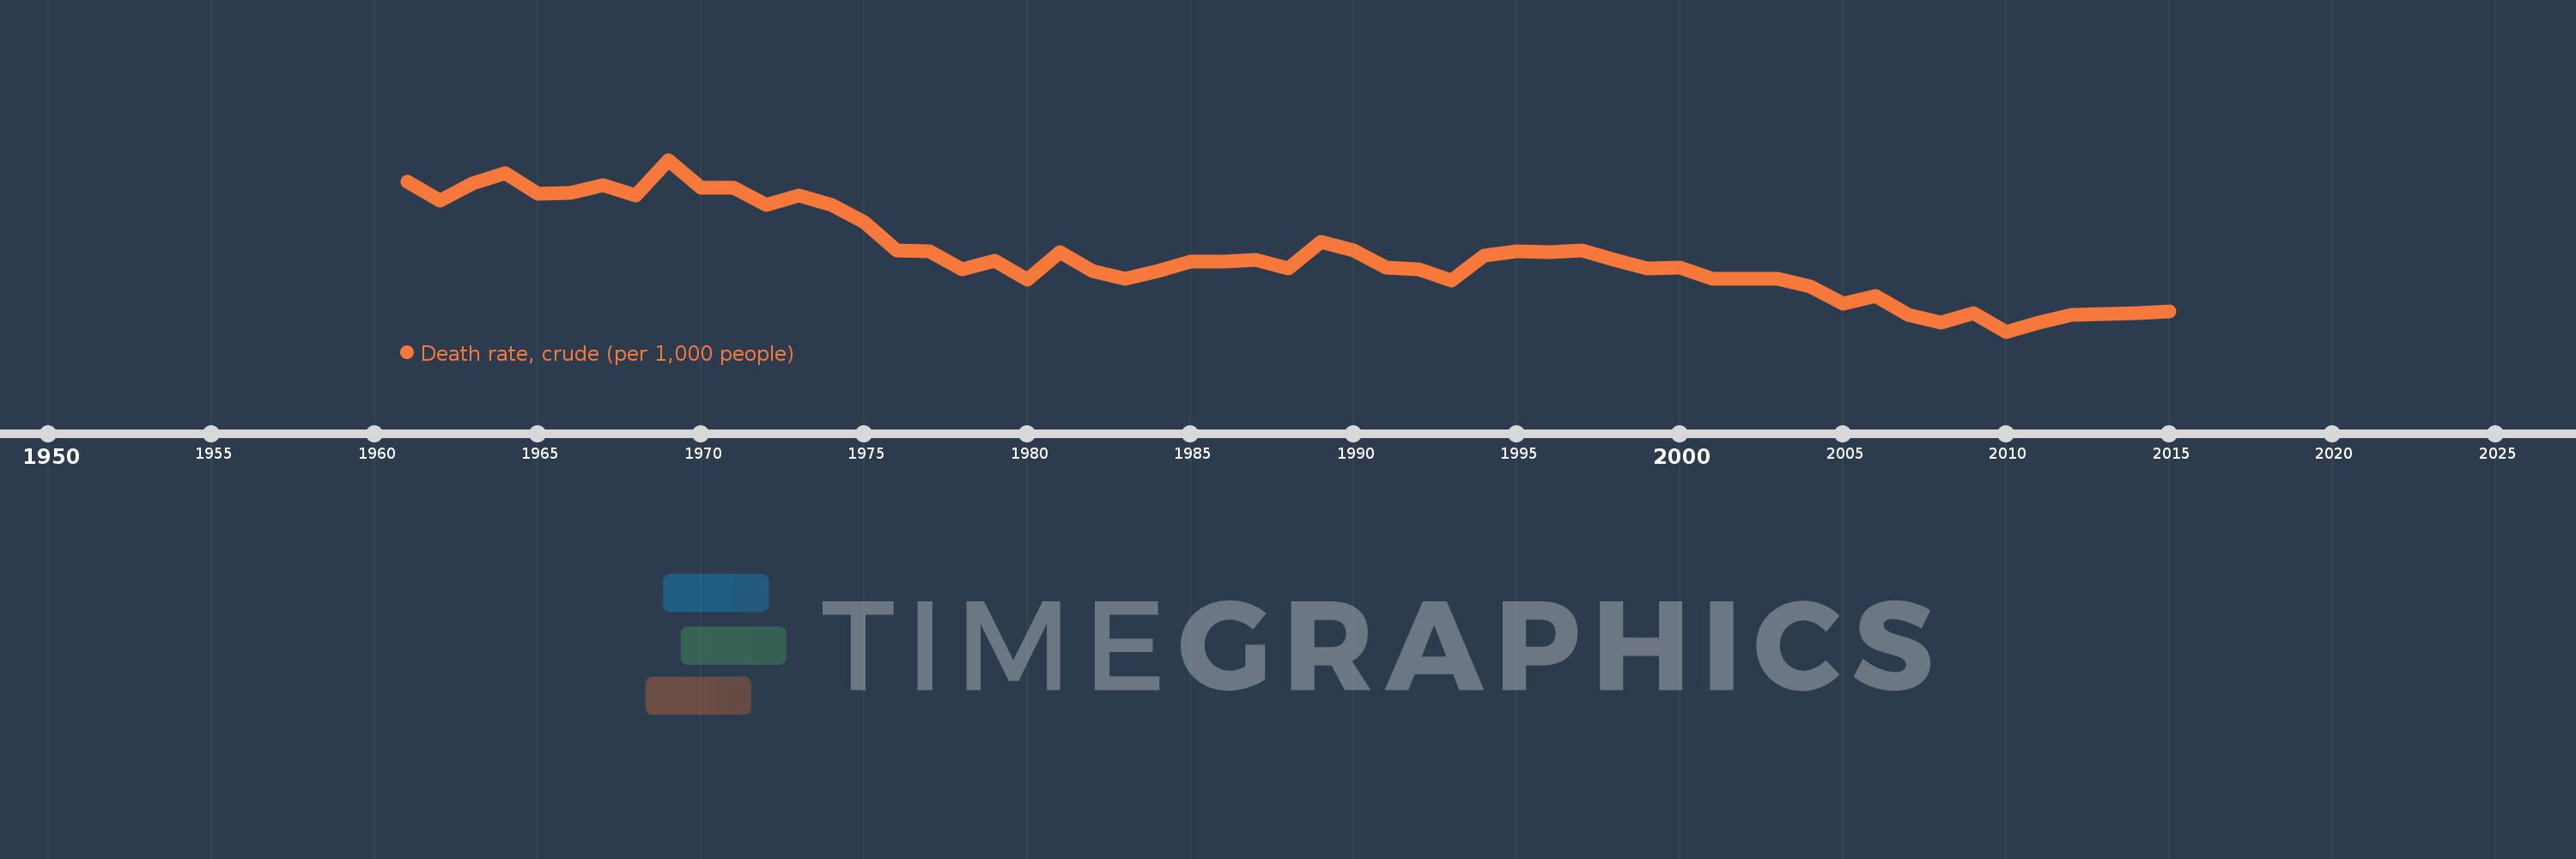
Death rate, crude (per 1,000 people)
2015,2014,2013,2012,2011,2010,2009,2008,2007,2006,2005,2004,2003,2002,2001,2000,1999,1998,1997,1996,1995,1994,1993,1992,1991,1990,1989,1988,1987,1986,1985,1984,1983,1982,1981,1980,1979,1978,1977,1976,1975,1974,1973,1972,1971,1970,1969,1968,1967,1966,1965,1964,1963,1962,1961
Diese Statistik in anderen Ländern:
AfghanistanAlbaniaAlgeriaAmerican SamoaAndorraAngolaAntigua and BarbudaArab WorldArgentinaArmeniaArubaAustraliaAustriaAzerbaijanBahamas, TheBahrainBangladeshBarbadosBelarusBelgiumBelizeBeninBermudaBhutanBoliviaBosnia and HerzegovinaBotswanaBrazilBrunei DarussalamBulgariaBurkina FasoBurundiCabo VerdeCambodiaCameroonCanadaCaribbean small statesCayman IslandsCentral African RepublicCentral Europe and the BalticsChadChannel IslandsChileChinaColombiaComorosCongo, Dem. Rep.Congo, Rep.Costa RicaCote d'IvoireCroatiaCubaCuracaoCyprusCzech RepublicDenmarkDjiboutiDominicaDominican RepublicEarly-demographic dividendEast Asia & PacificEast Asia & Pacific (excluding high income)East Asia & Pacific (IDA & IBRD countries)EcuadorEgypt, Arab Rep.El SalvadorEquatorial GuineaEritreaEstoniaEthiopiaEuro areaEurope & Central AsiaEurope & Central Asia (excluding high income)Europe & Central Asia (IDA & IBRD countries)European UnionFaroe IslandsFijiFinlandFragile and conflict affected situationsFranceFrench PolynesiaGabonGambia, TheGeorgiaGermanyGhanaGreeceGreenlandGrenadaGuamGuatemalaGuineaGuinea-BissauGuyanaHaitiHeavily indebted poor countries (HIPC)High incomeHondurasHong Kong SAR, ChinaHungaryIBRD onlyIcelandIDA & IBRD totalIDA blendIDA onlyIDA totalIndiaIndonesiaIran, Islamic Rep.IraqIrelandIsle of ManIsraelItalyJamaicaJapanJordanKazakhstanKenyaKiribatiKorea, Dem. People’s Rep.Korea, Rep.KosovoKuwaitKyrgyz RepublicLao PDRLate-demographic dividendLatin America & Caribbean Latin America & Caribbean (excluding high income)Latin America & the Caribbean (IDA & IBRD countries)LatviaLeast developed countries: UN classificationLebanonLesothoLiberiaLibyaLiechtensteinLithuaniaLow & middle incomeLow incomeLower middle incomeLuxembourgMacao SAR, ChinaMacedonia, FYRMadagascarMalawiMalaysiaMaldivesMaliMaltaMarshall IslandsMauritaniaMauritiusMexicoMicronesia, Fed. Sts.Middle East & North AfricaMiddle East & North Africa (excluding high income)Middle East & North Africa (IDA & IBRD countries)Middle incomeMoldovaMonacoMongoliaMontenegroMoroccoMozambiqueMyanmarNamibiaNepalNetherlandsNew CaledoniaNew ZealandNicaraguaNigerNigeriaNorth AmericaNorwayOECD membersOmanOther small statesPacific island small statesPakistanPalauPanamaPapua New GuineaParaguayPeruPhilippinesPolandPortugalPost-demographic dividendPre-demographic dividendPuerto RicoQatarRomaniaRussian FederationRwandaSamoaSan MarinoSao Tome and PrincipeSaudi ArabiaSenegalSerbiaSeychellesSierra LeoneSingaporeSint Maarten (Dutch part)Slovak RepublicSloveniaSmall statesSolomon IslandsSomaliaSouth AfricaSouth AsiaSouth Asia (IDA & IBRD)South SudanSpainSri LankaSt. Kitts and NevisSt. LuciaSt. Martin (French part)St. Vincent and the GrenadinesSub-Saharan Africa Sub-Saharan Africa (excluding high income)Sub-Saharan Africa (IDA & IBRD countries)SudanSurinameSwazilandSwedenSwitzerlandSyrian Arab RepublicTajikistanTanzaniaThailandTimor-LesteTogoTongaTrinidad and TobagoTunisiaTurkeyTurkmenistanUgandaUkraineUnited Arab EmiratesUnited KingdomUnited StatesUpper middle incomeUruguayUzbekistanVanuatuVenezuela, RBVietnamVirgin Islands (U.S.)West Bank and GazaWorldYemen, Rep.ZambiaZimbabwe Zeitlinie:
Diese Zeitleiste vorliegt die Graphik ab 1961 J. bis 2015 J. North America. Die Angaben bis 1960 J. sind nicht vorhanden. Die Zahl aktueller Beobachtungen nach Daten: 55.
Die Quelle (Bezeichnung):
Kennzahlen der Weltentwicklung
Die Quelle (Einrichtung):
(1) United Nations Population Division. World Population Prospects, (2) Census reports and other statistical publications from national statistical offices, (3) Eurostat: Demographic Statistics, (4) United Nations Statistical Division. Population and Vital Statistics Reprot (various years), (5) U.S. Census Bureau: International Database, and (6) Secretariat of the Pacific Community: Statistics and Demography Programme.
Kategorien:
Health
Es wurde aktualisiert:
23 Apr 2017 Jahr
Kennzahlen der Wertänderungen vom Jahr zum Jahr
Minimum:
7.821
1 Jan 2010 Jahr
Maximum:
9.575
1 Jan 1969 Jahr
Zum Datum der Beobachtung
Wert
Absolute Veränderung
Die Veränderung bezüglich dem vorherigen Wert
1 Jan 1961 Jahr
9.347
+9.347
0.0%
1 Jan 1962 Jahr
9.155
-0.192
-2.05%
1 Jan 1963 Jahr
9.336
+0.181
1.98%
1 Jan 1964 Jahr
9.436
+0.1
1.07%
1 Jan 1965 Jahr
9.226
-0.21
-2.22%
1 Jan 1966 Jahr
9.234
+0.008
0.09%
1 Jan 1967 Jahr
9.314
+0.08
0.87%
1 Jan 1968 Jahr
9.214
-0.101
-1.08%
1 Jan 1969 Jahr
9.575
+0.361
3.92%
1 Jan 1970 Jahr
9.293
-0.282
-2.94%
1 Jan 1971 Jahr
9.292
-0.001
-0.01%
1 Jan 1972 Jahr
9.111
-0.181
-1.95%
1 Jan 1973 Jahr
9.21
+0.099
1.09%
1 Jan 1974 Jahr
9.118
-0.092
-1.0%
1 Jan 1975 Jahr
8.936
-0.182
-2.0%
1 Jan 1976 Jahr
8.654
-0.282
-3.15%
1 Jan 1977 Jahr
8.644
-0.01
-0.12%
1 Jan 1978 Jahr
8.453
-0.19
-2.2%
1 Jan 1979 Jahr
8.544
+0.09
1.07%
1 Jan 1980 Jahr
8.354
-0.19
-2.22%
1 Jan 1981 Jahr
8.634
+0.28
3.35%
1 Jan 1982 Jahr
8.443
-0.19
-2.2%
1 Jan 1983 Jahr
8.363
-0.081
-0.96%
1 Jan 1984 Jahr
8.443
+0.08
0.96%
1 Jan 1985 Jahr
8.533
+0.09
1.06%
1 Jan 1986 Jahr
8.533
+0.0
0.0%
1 Jan 1987 Jahr
8.552
+0.02
0.23%
1 Jan 1988 Jahr
8.462
-0.091
-1.06%
1 Jan 1989 Jahr
8.741
+0.28
3.31%
1 Jan 1990 Jahr
8.65
-0.091
-1.05%
1 Jan 1991 Jahr
8.47
-0.181
-2.09%
1 Jan 1992 Jahr
8.46
-0.01
-0.12%
1 Jan 1993 Jahr
8.34
-0.12
-1.42%
1 Jan 1994 Jahr
8.6
+0.26
3.12%
1 Jan 1995 Jahr
8.641
+0.04
0.47%
1 Jan 1996 Jahr
8.631
-0.009
-0.11%
1 Jan 1997 Jahr
8.651
+0.02
0.23%
1 Jan 1998 Jahr
8.551
-0.099
-1.15%
1 Jan 1999 Jahr
8.462
-0.09
-1.05%
1 Jan 2000 Jahr
8.472
+0.01
0.12%
1 Jan 2001 Jahr
8.362
-0.11
-1.29%
1 Jan 2002 Jahr
8.362
0.0
0.0%
1 Jan 2003 Jahr
8.362
0.0
0.0%
1 Jan 2004 Jahr
8.282
-0.08
-0.96%
1 Jan 2005 Jahr
8.106
-0.175
-2.12%
1 Jan 2006 Jahr
8.182
+0.075
0.93%
1 Jan 2007 Jahr
7.992
-0.19
-2.32%
1 Jan 2008 Jahr
7.911
-0.08
-1.01%
1 Jan 2009 Jahr
8.011
+0.1
1.26%
1 Jan 2010 Jahr
7.821
-0.19
-2.37%
1 Jan 2011 Jahr
7.911
+0.09
1.15%
1 Jan 2012 Jahr
7.991
+0.08
1.01%
1 Jan 2013 Jahr
8.0
+0.01
0.12%
1 Jan 2014 Jahr
8.01
+0.01
0.12%
1 Jan 2015 Jahr
8.03
+0.02
0.25%
Bewertung der Länder gemäß mit laufender Statistik nach Jahren


Kommentare: