29
/de/
de
AIzaSyAYiBZKx7MnpbEhh9jyipgxe19OcubqV5w
April 1, 2024
164659
Jordan
JOR
true
2
1
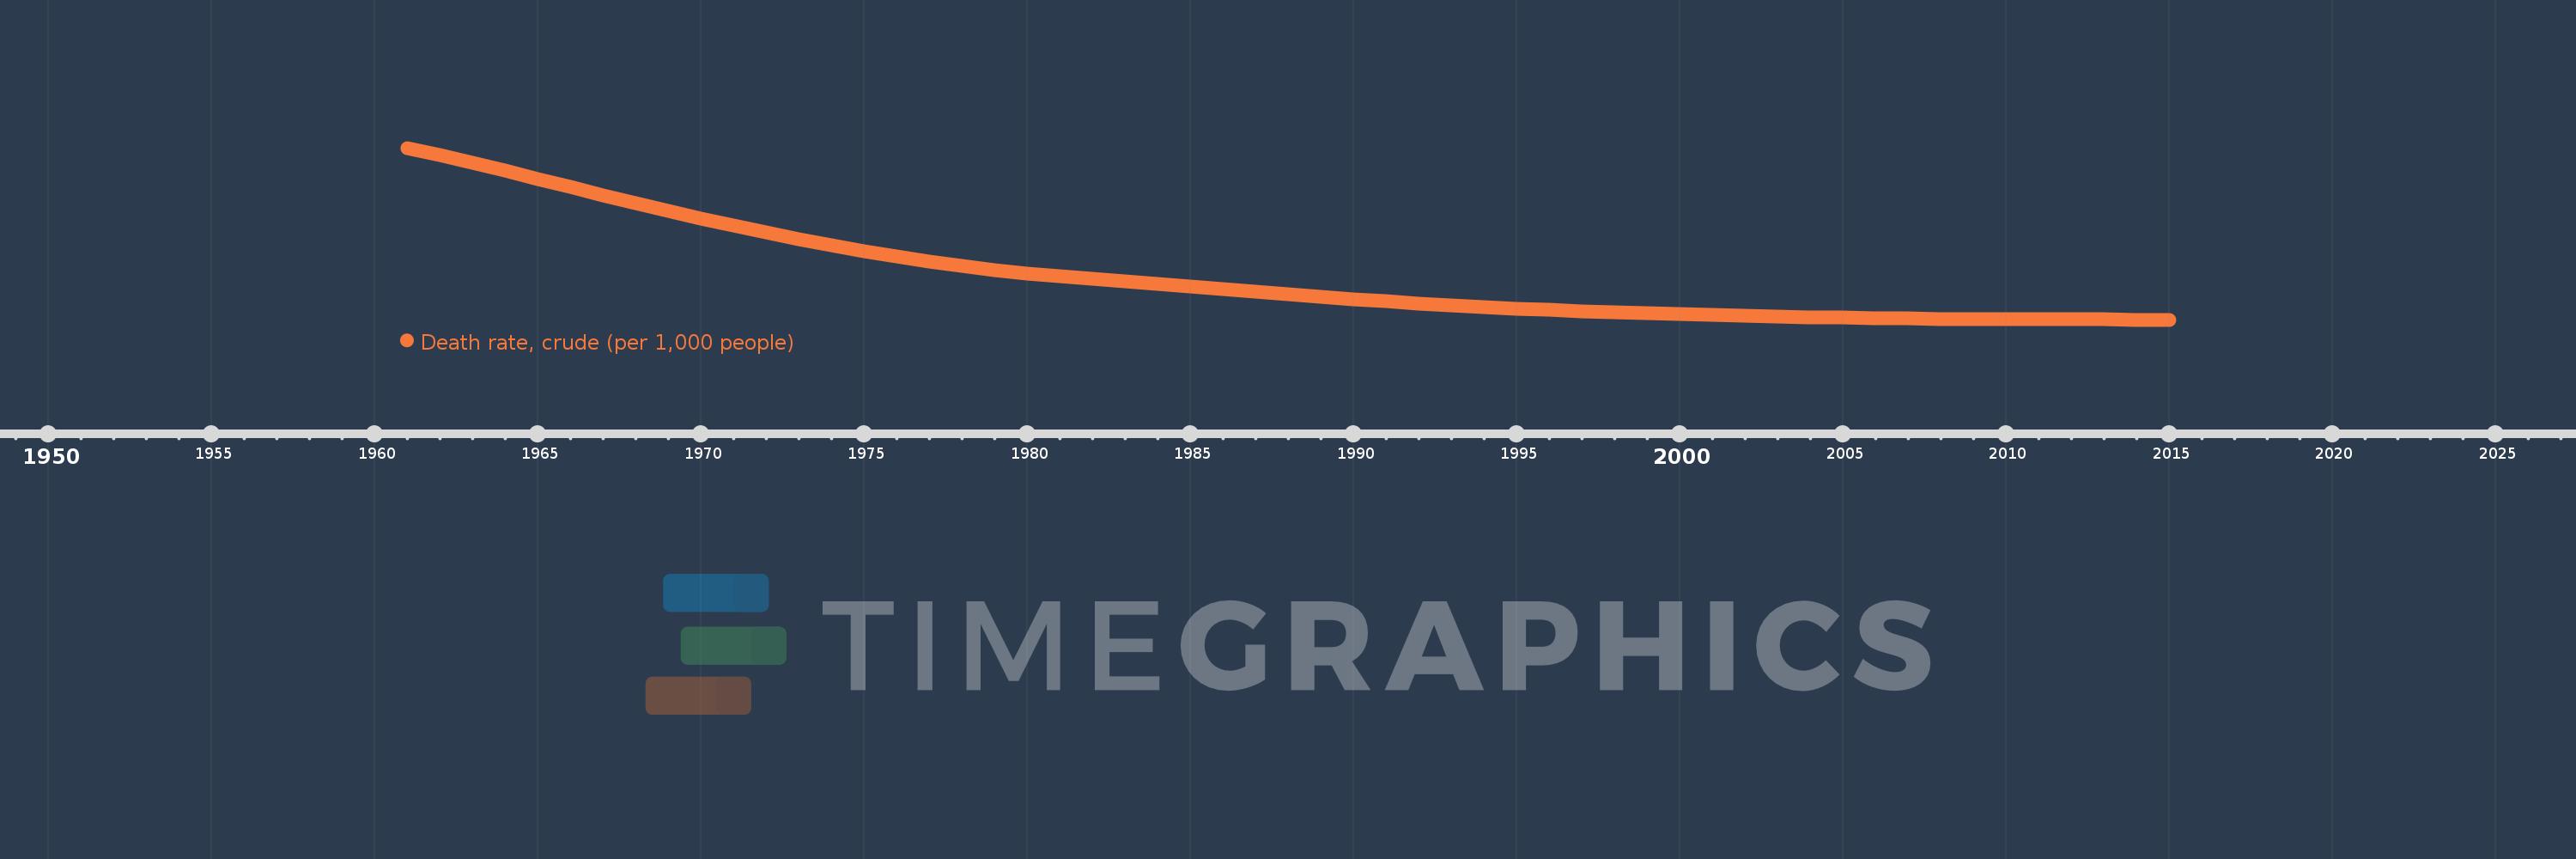
Death rate, crude (per 1,000 people)
2015,2014,2013,2012,2011,2010,2009,2008,2007,2006,2005,2004,2003,2002,2001,2000,1999,1998,1997,1996,1995,1994,1993,1992,1991,1990,1989,1988,1987,1986,1985,1984,1983,1982,1981,1980,1979,1978,1977,1976,1975,1974,1973,1972,1971,1970,1969,1968,1967,1966,1965,1964,1963,1962,1961
Diese Statistik in anderen Ländern:
AfghanistanAlbaniaAlgeriaAmerican SamoaAndorraAngolaAntigua and BarbudaArab WorldArgentinaArmeniaArubaAustraliaAustriaAzerbaijanBahamas, TheBahrainBangladeshBarbadosBelarusBelgiumBelizeBeninBermudaBhutanBoliviaBosnia and HerzegovinaBotswanaBrazilBrunei DarussalamBulgariaBurkina FasoBurundiCabo VerdeCambodiaCameroonCanadaCaribbean small statesCayman IslandsCentral African RepublicCentral Europe and the BalticsChadChannel IslandsChileChinaColombiaComorosCongo, Dem. Rep.Congo, Rep.Costa RicaCote d'IvoireCroatiaCubaCuracaoCyprusCzech RepublicDenmarkDjiboutiDominicaDominican RepublicEarly-demographic dividendEast Asia & PacificEast Asia & Pacific (excluding high income)East Asia & Pacific (IDA & IBRD countries)EcuadorEgypt, Arab Rep.El SalvadorEquatorial GuineaEritreaEstoniaEthiopiaEuro areaEurope & Central AsiaEurope & Central Asia (excluding high income)Europe & Central Asia (IDA & IBRD countries)European UnionFaroe IslandsFijiFinlandFragile and conflict affected situationsFranceFrench PolynesiaGabonGambia, TheGeorgiaGermanyGhanaGreeceGreenlandGrenadaGuamGuatemalaGuineaGuinea-BissauGuyanaHaitiHeavily indebted poor countries (HIPC)High incomeHondurasHong Kong SAR, ChinaHungaryIBRD onlyIcelandIDA & IBRD totalIDA blendIDA onlyIDA totalIndiaIndonesiaIran, Islamic Rep.IraqIrelandIsle of ManIsraelItalyJamaicaJapanJordanKazakhstanKenyaKiribatiKorea, Dem. People’s Rep.Korea, Rep.KosovoKuwaitKyrgyz RepublicLao PDRLate-demographic dividendLatin America & Caribbean Latin America & Caribbean (excluding high income)Latin America & the Caribbean (IDA & IBRD countries)LatviaLeast developed countries: UN classificationLebanonLesothoLiberiaLibyaLiechtensteinLithuaniaLow & middle incomeLow incomeLower middle incomeLuxembourgMacao SAR, ChinaMacedonia, FYRMadagascarMalawiMalaysiaMaldivesMaliMaltaMarshall IslandsMauritaniaMauritiusMexicoMicronesia, Fed. Sts.Middle East & North AfricaMiddle East & North Africa (excluding high income)Middle East & North Africa (IDA & IBRD countries)Middle incomeMoldovaMonacoMongoliaMontenegroMoroccoMozambiqueMyanmarNamibiaNepalNetherlandsNew CaledoniaNew ZealandNicaraguaNigerNigeriaNorth AmericaNorwayOECD membersOmanOther small statesPacific island small statesPakistanPalauPanamaPapua New GuineaParaguayPeruPhilippinesPolandPortugalPost-demographic dividendPre-demographic dividendPuerto RicoQatarRomaniaRussian FederationRwandaSamoaSan MarinoSao Tome and PrincipeSaudi ArabiaSenegalSerbiaSeychellesSierra LeoneSingaporeSint Maarten (Dutch part)Slovak RepublicSloveniaSmall statesSolomon IslandsSomaliaSouth AfricaSouth AsiaSouth Asia (IDA & IBRD)South SudanSpainSri LankaSt. Kitts and NevisSt. LuciaSt. Martin (French part)St. Vincent and the GrenadinesSub-Saharan Africa Sub-Saharan Africa (excluding high income)Sub-Saharan Africa (IDA & IBRD countries)SudanSurinameSwazilandSwedenSwitzerlandSyrian Arab RepublicTajikistanTanzaniaThailandTimor-LesteTogoTongaTrinidad and TobagoTunisiaTurkeyTurkmenistanUgandaUkraineUnited Arab EmiratesUnited KingdomUnited StatesUpper middle incomeUruguayUzbekistanVanuatuVenezuela, RBVietnamVirgin Islands (U.S.)West Bank and GazaWorldYemen, Rep.ZambiaZimbabwe Zeitlinie:
Diese Zeitleiste vorliegt die Graphik ab 1961 J. bis 2015 J. Jordan. Die Angaben bis 1960 J. sind nicht vorhanden. Die Zahl aktueller Beobachtungen nach Daten: 55.
Die Quelle (Bezeichnung):
Kennzahlen der Weltentwicklung
Die Quelle (Einrichtung):
(1) United Nations Population Division. World Population Prospects, (2) Census reports and other statistical publications from national statistical offices, (3) Eurostat: Demographic Statistics, (4) United Nations Statistical Division. Population and Vital Statistics Reprot (various years), (5) U.S. Census Bureau: International Database, and (6) Secretariat of the Pacific Community: Statistics and Demography Programme.
Kategorien:
Health
Es wurde aktualisiert:
23 Apr 2017 Jahr
Kennzahlen der Wertänderungen vom Jahr zum Jahr
Minimum:
3.843
1 Jan 2015 Jahr
Maximum:
15.833
1 Jan 1961 Jahr
Zum Datum der Beobachtung
Wert
Absolute Veränderung
Die Veränderung bezüglich dem vorherigen Wert
1 Jan 1961 Jahr
15.833
+15.833
0.0%
1 Jan 1962 Jahr
15.31
-0.523
-3.3%
1 Jan 1963 Jahr
14.78
-0.53
-3.46%
1 Jan 1964 Jahr
14.237
-0.543
-3.67%
1 Jan 1965 Jahr
13.679
-0.558
-3.92%
1 Jan 1966 Jahr
13.11
-0.569
-4.16%
1 Jan 1967 Jahr
12.537
-0.573
-4.37%
1 Jan 1968 Jahr
11.974
-0.563
-4.49%
1 Jan 1969 Jahr
11.429
-0.545
-4.55%
1 Jan 1970 Jahr
10.909
-0.52
-4.55%
1 Jan 1971 Jahr
10.414
-0.495
-4.54%
1 Jan 1972 Jahr
9.942
-0.472
-4.53%
1 Jan 1973 Jahr
9.489
-0.453
-4.56%
1 Jan 1974 Jahr
9.054
-0.435
-4.58%
1 Jan 1975 Jahr
8.639
-0.415
-4.58%
1 Jan 1976 Jahr
8.251
-0.388
-4.49%
1 Jan 1977 Jahr
7.898
-0.353
-4.28%
1 Jan 1978 Jahr
7.583
-0.315
-3.99%
1 Jan 1979 Jahr
7.308
-0.275
-3.63%
1 Jan 1980 Jahr
7.07
-0.238
-3.26%
1 Jan 1981 Jahr
6.862
-0.208
-2.94%
1 Jan 1982 Jahr
6.674
-0.188
-2.74%
1 Jan 1983 Jahr
6.498
-0.176
-2.64%
1 Jan 1984 Jahr
6.324
-0.174
-2.68%
1 Jan 1985 Jahr
6.149
-0.175
-2.77%
1 Jan 1986 Jahr
5.969
-0.18
-2.93%
1 Jan 1987 Jahr
5.785
-0.184
-3.08%
1 Jan 1988 Jahr
5.605
-0.18
-3.11%
1 Jan 1989 Jahr
5.432
-0.173
-3.09%
1 Jan 1990 Jahr
5.267
-0.165
-3.04%
1 Jan 1991 Jahr
5.114
-0.153
-2.9%
1 Jan 1992 Jahr
4.973
-0.141
-2.76%
1 Jan 1993 Jahr
4.844
-0.129
-2.59%
1 Jan 1994 Jahr
4.728
-0.116
-2.39%
1 Jan 1995 Jahr
4.622
-0.106
-2.24%
1 Jan 1996 Jahr
4.527
-0.095
-2.06%
1 Jan 1997 Jahr
4.442
-0.085
-1.88%
1 Jan 1998 Jahr
4.364
-0.078
-1.76%
1 Jan 1999 Jahr
4.292
-0.072
-1.65%
1 Jan 2000 Jahr
4.226
-0.066
-1.54%
1 Jan 2001 Jahr
4.165
-0.061
-1.44%
1 Jan 2002 Jahr
4.11
-0.055
-1.32%
1 Jan 2003 Jahr
4.061
-0.049
-1.19%
1 Jan 2004 Jahr
4.019
-0.042
-1.03%
1 Jan 2005 Jahr
3.983
-0.036
-0.9%
1 Jan 2006 Jahr
3.953
-0.03
-0.75%
1 Jan 2007 Jahr
3.929
-0.024
-0.61%
1 Jan 2008 Jahr
3.909
-0.02
-0.51%
1 Jan 2009 Jahr
3.894
-0.015
-0.38%
1 Jan 2010 Jahr
3.882
-0.012
-0.31%
1 Jan 2011 Jahr
3.871
-0.011
-0.28%
1 Jan 2012 Jahr
3.863
-0.008
-0.21%
1 Jan 2013 Jahr
3.855
-0.008
-0.21%
1 Jan 2014 Jahr
3.849
-0.006
-0.16%
1 Jan 2015 Jahr
3.843
-0.006
-0.16%
Bewertung der Länder gemäß mit laufender Statistik nach Jahren


Kommentare: