29
/de/
de
AIzaSyAYiBZKx7MnpbEhh9jyipgxe19OcubqV5w
April 1, 2024
48023
Middle East & North Africa
MEA
false
2
1
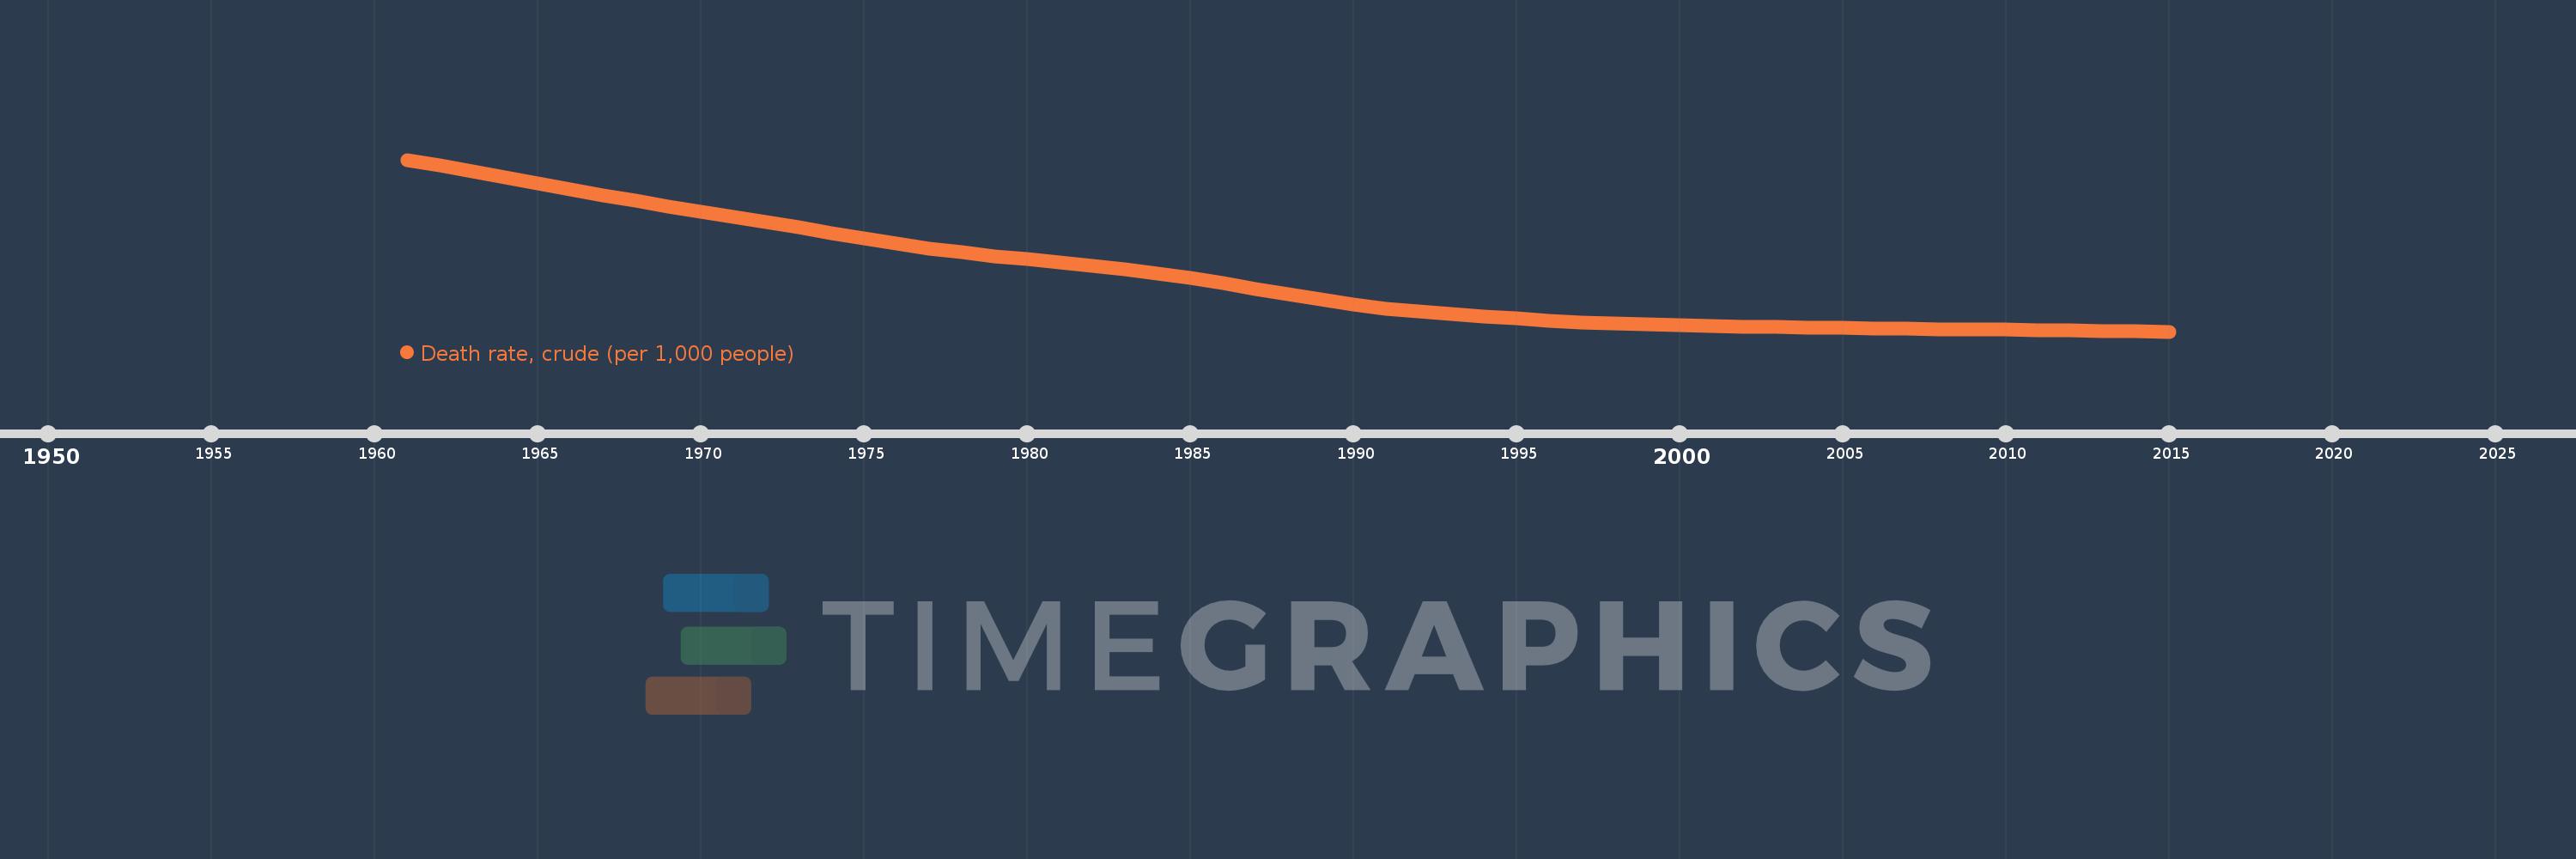
Death rate, crude (per 1,000 people)
2015,2014,2013,2012,2011,2010,2009,2008,2007,2006,2005,2004,2003,2002,2001,2000,1999,1998,1997,1996,1995,1994,1993,1992,1991,1990,1989,1988,1987,1986,1985,1984,1983,1982,1981,1980,1979,1978,1977,1976,1975,1974,1973,1972,1971,1970,1969,1968,1967,1966,1965,1964,1963,1962,1961
Diese Statistik in anderen Ländern:
AfghanistanAlbaniaAlgeriaAmerican SamoaAndorraAngolaAntigua and BarbudaArab WorldArgentinaArmeniaArubaAustraliaAustriaAzerbaijanBahamas, TheBahrainBangladeshBarbadosBelarusBelgiumBelizeBeninBermudaBhutanBoliviaBosnia and HerzegovinaBotswanaBrazilBrunei DarussalamBulgariaBurkina FasoBurundiCabo VerdeCambodiaCameroonCanadaCaribbean small statesCayman IslandsCentral African RepublicCentral Europe and the BalticsChadChannel IslandsChileChinaColombiaComorosCongo, Dem. Rep.Congo, Rep.Costa RicaCote d'IvoireCroatiaCubaCuracaoCyprusCzech RepublicDenmarkDjiboutiDominicaDominican RepublicEarly-demographic dividendEast Asia & PacificEast Asia & Pacific (excluding high income)East Asia & Pacific (IDA & IBRD countries)EcuadorEgypt, Arab Rep.El SalvadorEquatorial GuineaEritreaEstoniaEthiopiaEuro areaEurope & Central AsiaEurope & Central Asia (excluding high income)Europe & Central Asia (IDA & IBRD countries)European UnionFaroe IslandsFijiFinlandFragile and conflict affected situationsFranceFrench PolynesiaGabonGambia, TheGeorgiaGermanyGhanaGreeceGreenlandGrenadaGuamGuatemalaGuineaGuinea-BissauGuyanaHaitiHeavily indebted poor countries (HIPC)High incomeHondurasHong Kong SAR, ChinaHungaryIBRD onlyIcelandIDA & IBRD totalIDA blendIDA onlyIDA totalIndiaIndonesiaIran, Islamic Rep.IraqIrelandIsle of ManIsraelItalyJamaicaJapanJordanKazakhstanKenyaKiribatiKorea, Dem. People’s Rep.Korea, Rep.KosovoKuwaitKyrgyz RepublicLao PDRLate-demographic dividendLatin America & Caribbean Latin America & Caribbean (excluding high income)Latin America & the Caribbean (IDA & IBRD countries)LatviaLeast developed countries: UN classificationLebanonLesothoLiberiaLibyaLiechtensteinLithuaniaLow & middle incomeLow incomeLower middle incomeLuxembourgMacao SAR, ChinaMacedonia, FYRMadagascarMalawiMalaysiaMaldivesMaliMaltaMarshall IslandsMauritaniaMauritiusMexicoMicronesia, Fed. Sts.Middle East & North AfricaMiddle East & North Africa (excluding high income)Middle East & North Africa (IDA & IBRD countries)Middle incomeMoldovaMonacoMongoliaMontenegroMoroccoMozambiqueMyanmarNamibiaNepalNetherlandsNew CaledoniaNew ZealandNicaraguaNigerNigeriaNorth AmericaNorwayOECD membersOmanOther small statesPacific island small statesPakistanPalauPanamaPapua New GuineaParaguayPeruPhilippinesPolandPortugalPost-demographic dividendPre-demographic dividendPuerto RicoQatarRomaniaRussian FederationRwandaSamoaSan MarinoSao Tome and PrincipeSaudi ArabiaSenegalSerbiaSeychellesSierra LeoneSingaporeSint Maarten (Dutch part)Slovak RepublicSloveniaSmall statesSolomon IslandsSomaliaSouth AfricaSouth AsiaSouth Asia (IDA & IBRD)South SudanSpainSri LankaSt. Kitts and NevisSt. LuciaSt. Martin (French part)St. Vincent and the GrenadinesSub-Saharan Africa Sub-Saharan Africa (excluding high income)Sub-Saharan Africa (IDA & IBRD countries)SudanSurinameSwazilandSwedenSwitzerlandSyrian Arab RepublicTajikistanTanzaniaThailandTimor-LesteTogoTongaTrinidad and TobagoTunisiaTurkeyTurkmenistanUgandaUkraineUnited Arab EmiratesUnited KingdomUnited StatesUpper middle incomeUruguayUzbekistanVanuatuVenezuela, RBVietnamVirgin Islands (U.S.)West Bank and GazaWorldYemen, Rep.ZambiaZimbabwe Zeitlinie:
Diese Zeitleiste vorliegt die Graphik ab 1961 J. bis 2015 J. Middle East & North Africa. Die Angaben bis 1960 J. sind nicht vorhanden. Die Zahl aktueller Beobachtungen nach Daten: 55.
Die Quelle (Bezeichnung):
Kennzahlen der Weltentwicklung
Die Quelle (Einrichtung):
(1) United Nations Population Division. World Population Prospects, (2) Census reports and other statistical publications from national statistical offices, (3) Eurostat: Demographic Statistics, (4) United Nations Statistical Division. Population and Vital Statistics Reprot (various years), (5) U.S. Census Bureau: International Database, and (6) Secretariat of the Pacific Community: Statistics and Demography Programme.
Kategorien:
Health
Es wurde aktualisiert:
23 Apr 2017 Jahr
Kennzahlen der Wertänderungen vom Jahr zum Jahr
Minimum:
5.154
1 Jan 2015 Jahr
Maximum:
19.854
1 Jan 1961 Jahr
Zum Datum der Beobachtung
Wert
Absolute Veränderung
Die Veränderung bezüglich dem vorherigen Wert
1 Jan 1961 Jahr
19.854
+19.854
0.0%
1 Jan 1962 Jahr
19.349
-0.505
-2.54%
1 Jan 1963 Jahr
18.844
-0.505
-2.61%
1 Jan 1964 Jahr
18.342
-0.503
-2.67%
1 Jan 1965 Jahr
17.837
-0.505
-2.75%
1 Jan 1966 Jahr
17.334
-0.503
-2.82%
1 Jan 1967 Jahr
16.836
-0.498
-2.87%
1 Jan 1968 Jahr
16.35
-0.486
-2.89%
1 Jan 1969 Jahr
15.884
-0.465
-2.85%
1 Jan 1970 Jahr
15.43
-0.454
-2.86%
1 Jan 1971 Jahr
14.981
-0.449
-2.91%
1 Jan 1972 Jahr
14.525
-0.456
-3.04%
1 Jan 1973 Jahr
14.07
-0.455
-3.13%
1 Jan 1974 Jahr
13.602
-0.468
-3.33%
1 Jan 1975 Jahr
13.141
-0.461
-3.39%
1 Jan 1976 Jahr
12.697
-0.444
-3.38%
1 Jan 1977 Jahr
12.28
-0.417
-3.28%
1 Jan 1978 Jahr
11.922
-0.358
-2.92%
1 Jan 1979 Jahr
11.607
-0.314
-2.64%
1 Jan 1980 Jahr
11.329
-0.278
-2.4%
1 Jan 1981 Jahr
11.074
-0.255
-2.25%
1 Jan 1982 Jahr
10.801
-0.273
-2.47%
1 Jan 1983 Jahr
10.504
-0.297
-2.75%
1 Jan 1984 Jahr
10.147
-0.357
-3.4%
1 Jan 1985 Jahr
9.731
-0.415
-4.09%
1 Jan 1986 Jahr
9.273
-0.458
-4.71%
1 Jan 1987 Jahr
8.797
-0.476
-5.13%
1 Jan 1988 Jahr
8.323
-0.474
-5.39%
1 Jan 1989 Jahr
7.88
-0.443
-5.32%
1 Jan 1990 Jahr
7.495
-0.385
-4.89%
1 Jan 1991 Jahr
7.137
-0.358
-4.78%
1 Jan 1992 Jahr
6.854
-0.282
-3.96%
1 Jan 1993 Jahr
6.645
-0.209
-3.05%
1 Jan 1994 Jahr
6.45
-0.195
-2.93%
1 Jan 1995 Jahr
6.271
-0.179
-2.78%
1 Jan 1996 Jahr
6.098
-0.173
-2.76%
1 Jan 1997 Jahr
5.955
-0.144
-2.35%
1 Jan 1998 Jahr
5.849
-0.105
-1.77%
1 Jan 1999 Jahr
5.758
-0.091
-1.55%
1 Jan 2000 Jahr
5.683
-0.075
-1.31%
1 Jan 2001 Jahr
5.615
-0.068
-1.2%
1 Jan 2002 Jahr
5.561
-0.054
-0.97%
1 Jan 2003 Jahr
5.528
-0.032
-0.58%
1 Jan 2004 Jahr
5.506
-0.022
-0.4%
1 Jan 2005 Jahr
5.472
-0.035
-0.63%
1 Jan 2006 Jahr
5.442
-0.03
-0.54%
1 Jan 2007 Jahr
5.402
-0.04
-0.73%
1 Jan 2008 Jahr
5.368
-0.034
-0.63%
1 Jan 2009 Jahr
5.342
-0.026
-0.49%
1 Jan 2010 Jahr
5.305
-0.038
-0.7%
1 Jan 2011 Jahr
5.273
-0.031
-0.59%
1 Jan 2012 Jahr
5.249
-0.024
-0.46%
1 Jan 2013 Jahr
5.222
-0.028
-0.53%
1 Jan 2014 Jahr
5.188
-0.034
-0.65%
1 Jan 2015 Jahr
5.154
-0.033
-0.64%
Bewertung der Länder gemäß mit laufender Statistik nach Jahren


Kommentare: