29
/de/
de
AIzaSyAYiBZKx7MnpbEhh9jyipgxe19OcubqV5w
April 1, 2024
50904
Middle income
MIC
false
2
1
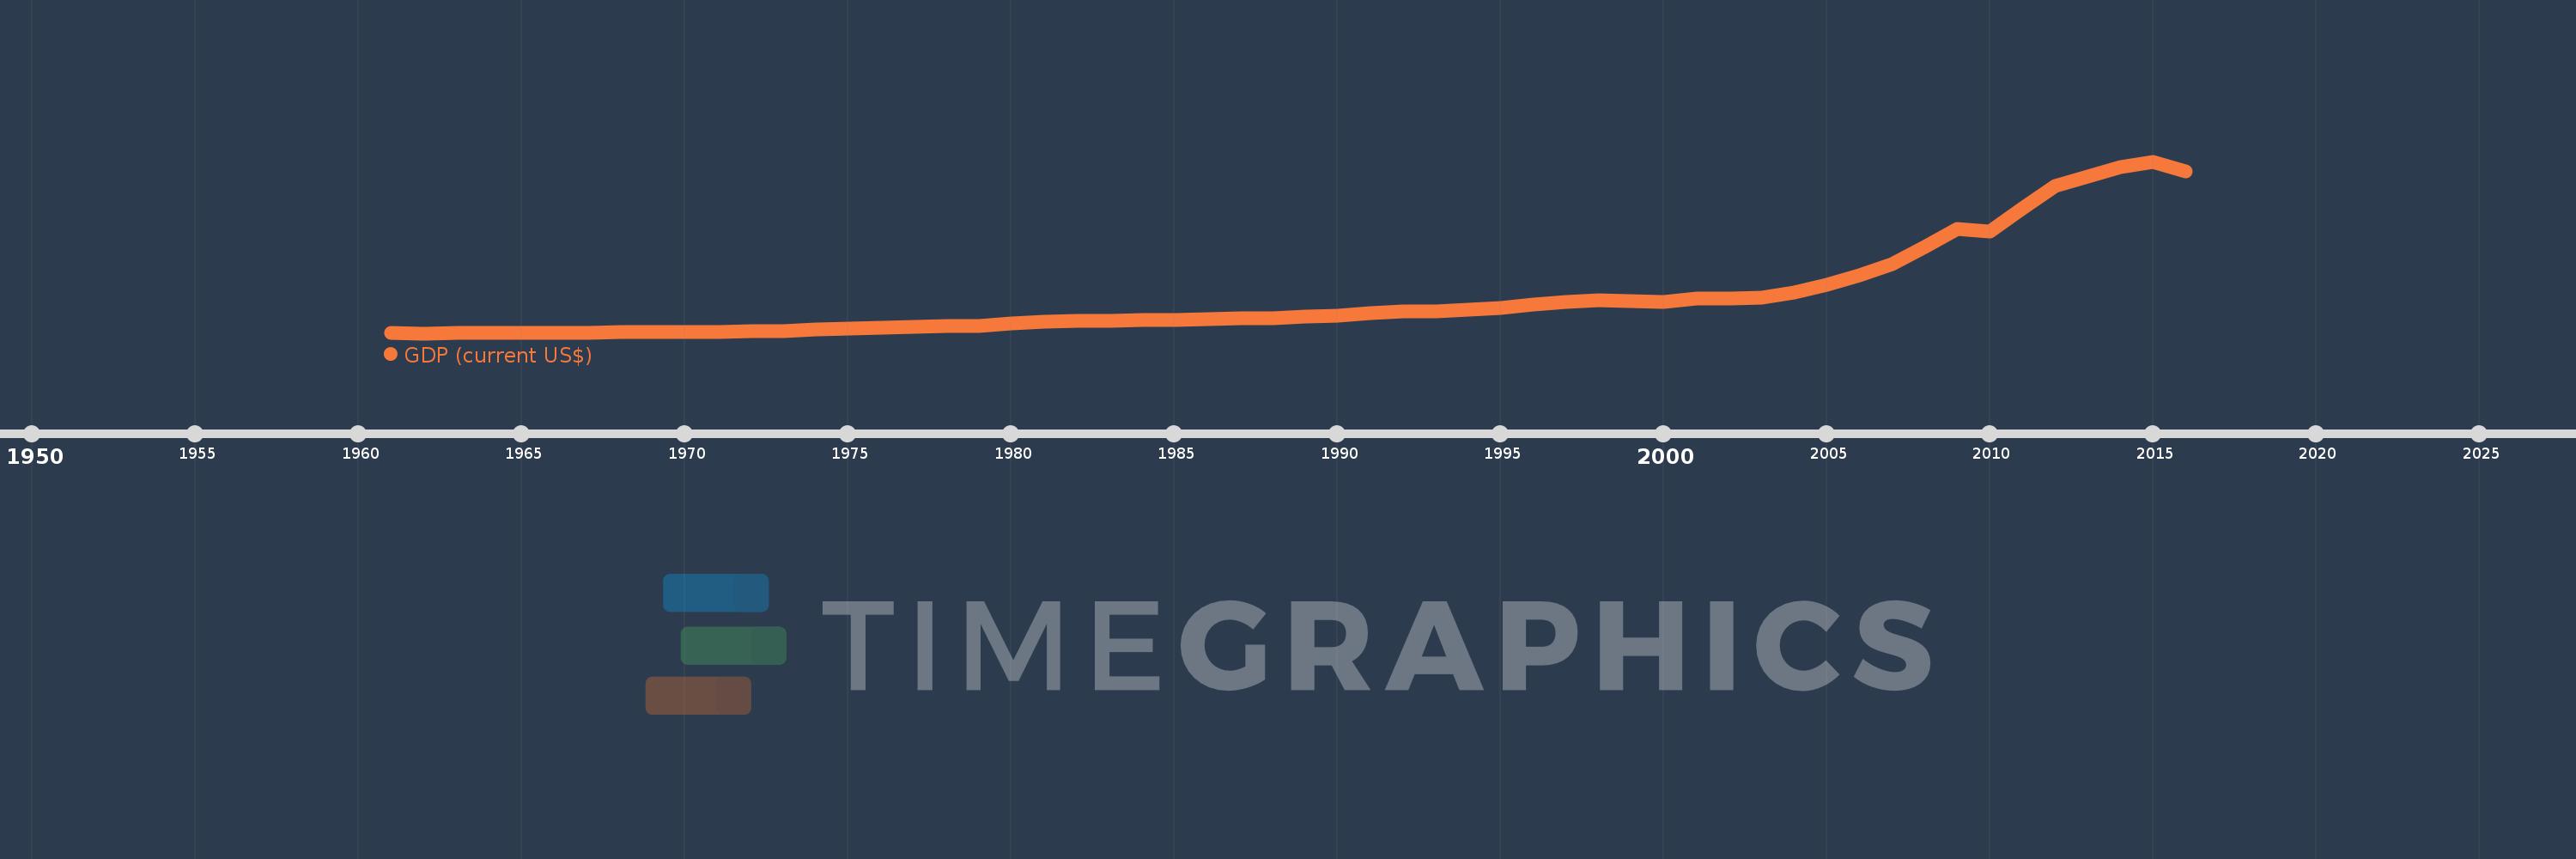
GDP (current US$)
2016,2015,2014,2013,2012,2011,2010,2009,2008,2007,2006,2005,2004,2003,2002,2001,2000,1999,1998,1997,1996,1995,1994,1993,1992,1991,1990,1989,1988,1987,1986,1985,1984,1983,1982,1981,1980,1979,1978,1977,1976,1975,1974,1973,1972,1971,1970,1969,1968,1967,1966,1965,1964,1963,1962,1961
Diese Statistik in anderen Ländern:
AfghanistanAlbaniaAlgeriaAndorraAngolaAntigua and BarbudaArab WorldArgentinaArmeniaArubaAustraliaAustriaAzerbaijanBahamas, TheBahrainBangladeshBarbadosBelarusBelgiumBelizeBeninBermudaBhutanBoliviaBosnia and HerzegovinaBotswanaBrazilBrunei DarussalamBulgariaBurkina FasoBurundiCabo VerdeCambodiaCameroonCanadaCaribbean small statesCayman IslandsCentral African RepublicCentral Europe and the BalticsChadChannel IslandsChileChinaColombiaComorosCongo, Dem. Rep.Congo, Rep.Costa RicaCote d'IvoireCroatiaCubaCyprusCzech RepublicDenmarkDjiboutiDominicaDominican RepublicEarly-demographic dividendEast Asia & PacificEast Asia & Pacific (excluding high income)East Asia & Pacific (IDA & IBRD countries)EcuadorEgypt, Arab Rep.El SalvadorEquatorial GuineaEritreaEstoniaEthiopiaEuro areaEurope & Central AsiaEurope & Central Asia (excluding high income)Europe & Central Asia (IDA & IBRD countries)European UnionFaroe IslandsFijiFinlandFragile and conflict affected situationsFranceFrench PolynesiaGabonGambia, TheGeorgiaGermanyGhanaGreeceGreenlandGrenadaGuatemalaGuineaGuinea-BissauGuyanaHaitiHeavily indebted poor countries (HIPC)High incomeHondurasHong Kong SAR, ChinaHungaryIBRD onlyIcelandIDA & IBRD totalIDA blendIDA onlyIDA totalIndiaIndonesiaIran, Islamic Rep.IraqIrelandIsle of ManIsraelItalyJamaicaJapanJordanKazakhstanKenyaKiribatiKorea, Rep.KosovoKuwaitKyrgyz RepublicLao PDRLate-demographic dividendLatin America & Caribbean Latin America & Caribbean (excluding high income)Latin America & the Caribbean (IDA & IBRD countries)LatviaLeast developed countries: UN classificationLebanonLesothoLiberiaLibyaLiechtensteinLithuaniaLow & middle incomeLow incomeLower middle incomeLuxembourgMacao SAR, ChinaMacedonia, FYRMadagascarMalawiMalaysiaMaldivesMaliMaltaMarshall IslandsMauritaniaMauritiusMexicoMicronesia, Fed. Sts.Middle East & North AfricaMiddle East & North Africa (excluding high income)Middle East & North Africa (IDA & IBRD countries)Middle incomeMoldovaMonacoMongoliaMontenegroMoroccoMozambiqueMyanmarNamibiaNauruNepalNetherlandsNew CaledoniaNew ZealandNicaraguaNigerNigeriaNorth AmericaNorwayOECD membersOmanOther small statesPacific island small statesPakistanPalauPanamaPapua New GuineaParaguayPeruPhilippinesPolandPortugalPost-demographic dividendPre-demographic dividendPuerto RicoQatarRomaniaRussian FederationRwandaSamoaSan MarinoSao Tome and PrincipeSaudi ArabiaSenegalSerbiaSeychellesSierra LeoneSingaporeSlovak RepublicSloveniaSmall statesSolomon IslandsSomaliaSouth AfricaSouth AsiaSouth Asia (IDA & IBRD)South SudanSpainSri LankaSt. Kitts and NevisSt. LuciaSt. Vincent and the GrenadinesSub-Saharan Africa Sub-Saharan Africa (excluding high income)Sub-Saharan Africa (IDA & IBRD countries)SudanSurinameSwazilandSwedenSwitzerlandSyrian Arab RepublicTajikistanTanzaniaThailandTimor-LesteTogoTongaTrinidad and TobagoTunisiaTurkeyTurkmenistanTuvaluUgandaUkraineUnited Arab EmiratesUnited KingdomUnited StatesUpper middle incomeUruguayUzbekistanVanuatuVenezuela, RBVietnamVirgin Islands (U.S.)West Bank and GazaWorldYemen, Rep.ZambiaZimbabwe Zeitlinie:
Diese Zeitleiste vorliegt die Graphik ab 1961 J. bis 2016 J. Middle income. Die Angaben bis 1960 J. sind nicht vorhanden. Die Zahl aktueller Beobachtungen nach Daten: 56.
Die Quelle (Bezeichnung):
Kennzahlen der Weltentwicklung
Die Quelle (Einrichtung):
World Bank national accounts data, and OECD National Accounts data files.
Kategorien:
Economy & Growth
Es wurde aktualisiert:
23 Apr 2017 Jahr
Kennzahlen der Wertänderungen vom Jahr zum Jahr
im Durchschnitt:
6.06 Trln
Minimum:
286.903 Mlrd.
1 Jan 1962 Jahr
Maximum:
27.92 Trln
1 Jan 2015 Jahr
Zum Datum der Beobachtung
Wert
Absolute Veränderung
Die Veränderung bezüglich dem vorherigen Wert
1 Jan 1961 Jahr
299.08 Mlrd.
+299.08 Mlrd.
0.0%
1 Jan 1962 Jahr
286.903 Mlrd.
-12.176 Mlrd.
-4.07%
1 Jan 1963 Jahr
293.165 Mlrd.
+6.262 Mlrd.
2.18%
1 Jan 1964 Jahr
322.308 Mlrd.
+29.143 Mlrd.
9.94%
1 Jan 1965 Jahr
363.566 Mlrd.
+41.258 Mlrd.
12.8%
1 Jan 1966 Jahr
402.918 Mlrd.
+39.352 Mlrd.
10.82%
1 Jan 1967 Jahr
409.796 Mlrd.
+6.878 Mlrd.
1.71%
1 Jan 1968 Jahr
425.796 Mlrd.
+16.0 Mlrd.
3.9%
1 Jan 1969 Jahr
447.425 Mlrd.
+21.629 Mlrd.
5.08%
1 Jan 1970 Jahr
498.284 Mlrd.
+50.859 Mlrd.
11.37%
1 Jan 1971 Jahr
548.563 Mlrd.
+50.279 Mlrd.
10.09%
1 Jan 1972 Jahr
587.607 Mlrd.
+39.044 Mlrd.
7.12%
1 Jan 1973 Jahr
668.155 Mlrd.
+80.548 Mlrd.
13.71%
1 Jan 1974 Jahr
844.129 Mlrd.
+175.975 Mlrd.
26.34%
1 Jan 1975 Jahr
1.076 Trln
+231.673 Mlrd.
27.45%
1 Jan 1976 Jahr
1.184 Trln
+107.701 Mlrd.
10.01%
1 Jan 1977 Jahr
1.265 Trln
+81.779 Mlrd.
6.91%
1 Jan 1978 Jahr
1.417 Trln
+151.857 Mlrd.
12.0%
1 Jan 1979 Jahr
1.521 Trln
+103.864 Mlrd.
7.33%
1 Jan 1980 Jahr
1.832 Trln
+310.959 Mlrd.
20.44%
1 Jan 1981 Jahr
2.183 Trln
+351.418 Mlrd.
19.18%
1 Jan 1982 Jahr
2.341 Trln
+157.543 Mlrd.
7.22%
1 Jan 1983 Jahr
2.298 Trln
-43.39 Mlrd.
-1.85%
1 Jan 1984 Jahr
2.389 Trln
+91.597 Mlrd.
3.99%
1 Jan 1985 Jahr
2.409 Trln
+19.733 Mlrd.
0.83%
1 Jan 1986 Jahr
2.546 Trln
+136.698 Mlrd.
5.67%
1 Jan 1987 Jahr
2.66 Trln
+114.445 Mlrd.
4.5%
1 Jan 1988 Jahr
2.736 Trln
+75.849 Mlrd.
2.85%
1 Jan 1989 Jahr
2.953 Trln
+217.348 Mlrd.
7.94%
1 Jan 1990 Jahr
3.14 Trln
+186.804 Mlrd.
6.33%
1 Jan 1991 Jahr
3.548 Trln
+408.392 Mlrd.
13.01%
1 Jan 1992 Jahr
3.799 Trln
+250.74 Mlrd.
7.07%
1 Jan 1993 Jahr
3.774 Trln
-24.947 Mlrd.
-0.66%
1 Jan 1994 Jahr
4.033 Trln
+259.267 Mlrd.
6.87%
1 Jan 1995 Jahr
4.394 Trln
+360.737 Mlrd.
8.94%
1 Jan 1996 Jahr
4.911 Trln
+516.765 Mlrd.
11.76%
1 Jan 1997 Jahr
5.352 Trln
+440.677 Mlrd.
8.97%
1 Jan 1998 Jahr
5.663 Trln
+311.83 Mlrd.
5.83%
1 Jan 1999 Jahr
5.48 Trln
-183.481 Mlrd.
-3.24%
1 Jan 2000 Jahr
5.35 Trln
-129.972 Mlrd.
-2.37%
1 Jan 2001 Jahr
5.837 Trln
+487.371 Mlrd.
9.11%
1 Jan 2002 Jahr
5.905 Trln
+67.398 Mlrd.
1.15%
1 Jan 2003 Jahr
6.016 Trln
+110.753 Mlrd.
1.88%
1 Jan 2004 Jahr
6.802 Trln
+786.405 Mlrd.
13.07%
1 Jan 2005 Jahr
8.072 Trln
+1.27 Trln
18.67%
1 Jan 2006 Jahr
9.621 Trln
+1.549 Trln
19.19%
1 Jan 2007 Jahr
11.442 Trln
+1.821 Trln
18.93%
1 Jan 2008 Jahr
14.164 Trln
+2.722 Trln
23.79%
1 Jan 2009 Jahr
17.016 Trln
+2.852 Trln
20.14%
1 Jan 2010 Jahr
16.605 Trln
-411.391 Mlrd.
-2.42%
1 Jan 2011 Jahr
20.331 Trln
+3.726 Trln
22.44%
1 Jan 2012 Jahr
24.039 Trln
+3.708 Trln
18.24%
1 Jan 2013 Jahr
25.506 Trln
+1.466 Trln
6.1%
1 Jan 2014 Jahr
27.055 Trln
+1.549 Trln
6.07%
1 Jan 2015 Jahr
27.92 Trln
+864.579 Mlrd.
3.2%
1 Jan 2016 Jahr
26.367 Trln
-1.553 Trln
-5.56%
Bewertung der Länder gemäß mit laufender Statistik nach Jahren


Kommentare: