29
/de/
de
AIzaSyAYiBZKx7MnpbEhh9jyipgxe19OcubqV5w
April 1, 2024
35733
High income
HIC
false
2
1
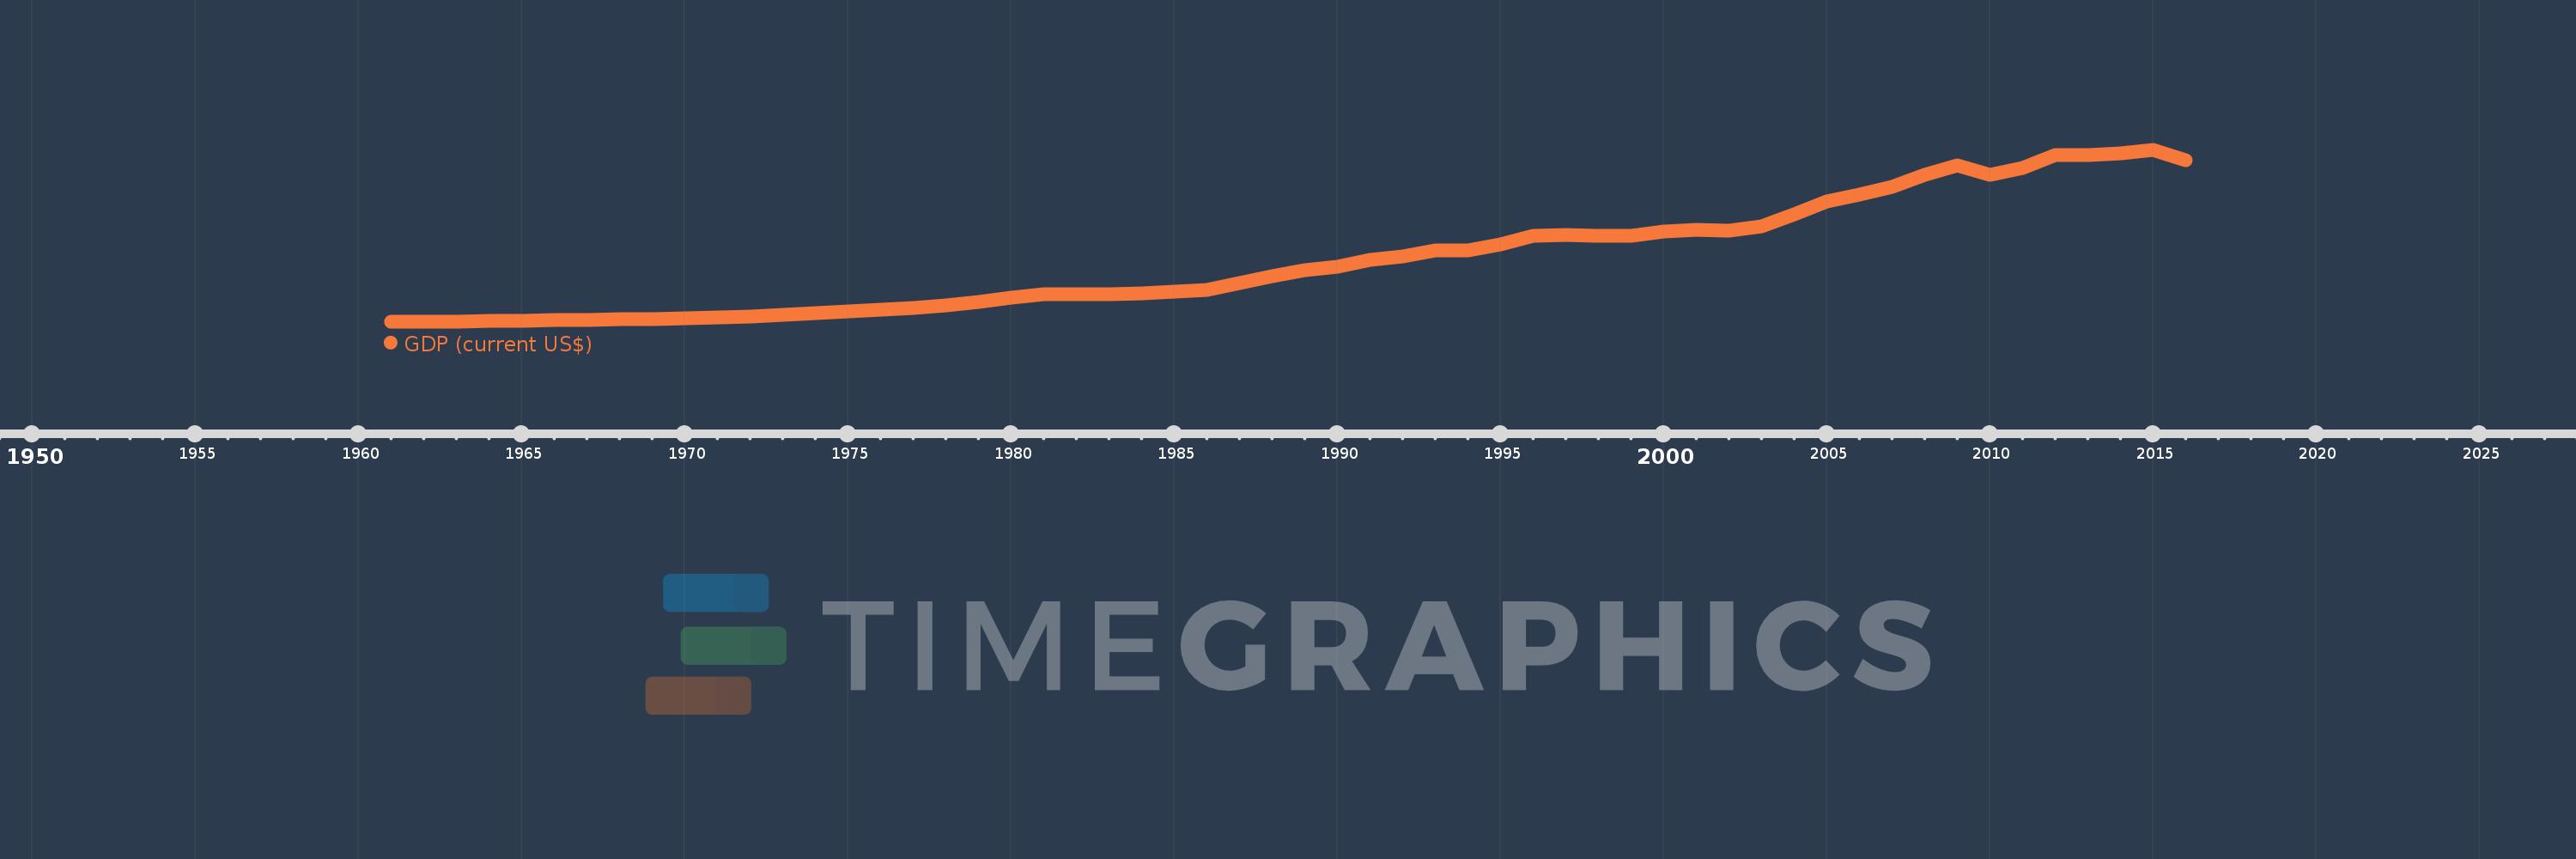
GDP (current US$)
2016,2015,2014,2013,2012,2011,2010,2009,2008,2007,2006,2005,2004,2003,2002,2001,2000,1999,1998,1997,1996,1995,1994,1993,1992,1991,1990,1989,1988,1987,1986,1985,1984,1983,1982,1981,1980,1979,1978,1977,1976,1975,1974,1973,1972,1971,1970,1969,1968,1967,1966,1965,1964,1963,1962,1961
Diese Statistik in anderen Ländern:
AfghanistanAlbaniaAlgeriaAndorraAngolaAntigua and BarbudaArab WorldArgentinaArmeniaArubaAustraliaAustriaAzerbaijanBahamas, TheBahrainBangladeshBarbadosBelarusBelgiumBelizeBeninBermudaBhutanBoliviaBosnia and HerzegovinaBotswanaBrazilBrunei DarussalamBulgariaBurkina FasoBurundiCabo VerdeCambodiaCameroonCanadaCaribbean small statesCayman IslandsCentral African RepublicCentral Europe and the BalticsChadChannel IslandsChileChinaColombiaComorosCongo, Dem. Rep.Congo, Rep.Costa RicaCote d'IvoireCroatiaCubaCyprusCzech RepublicDenmarkDjiboutiDominicaDominican RepublicEarly-demographic dividendEast Asia & PacificEast Asia & Pacific (excluding high income)East Asia & Pacific (IDA & IBRD countries)EcuadorEgypt, Arab Rep.El SalvadorEquatorial GuineaEritreaEstoniaEthiopiaEuro areaEurope & Central AsiaEurope & Central Asia (excluding high income)Europe & Central Asia (IDA & IBRD countries)European UnionFaroe IslandsFijiFinlandFragile and conflict affected situationsFranceFrench PolynesiaGabonGambia, TheGeorgiaGermanyGhanaGreeceGreenlandGrenadaGuatemalaGuineaGuinea-BissauGuyanaHaitiHeavily indebted poor countries (HIPC)High incomeHondurasHong Kong SAR, ChinaHungaryIBRD onlyIcelandIDA & IBRD totalIDA blendIDA onlyIDA totalIndiaIndonesiaIran, Islamic Rep.IraqIrelandIsle of ManIsraelItalyJamaicaJapanJordanKazakhstanKenyaKiribatiKorea, Rep.KosovoKuwaitKyrgyz RepublicLao PDRLate-demographic dividendLatin America & Caribbean Latin America & Caribbean (excluding high income)Latin America & the Caribbean (IDA & IBRD countries)LatviaLeast developed countries: UN classificationLebanonLesothoLiberiaLibyaLiechtensteinLithuaniaLow & middle incomeLow incomeLower middle incomeLuxembourgMacao SAR, ChinaMacedonia, FYRMadagascarMalawiMalaysiaMaldivesMaliMaltaMarshall IslandsMauritaniaMauritiusMexicoMicronesia, Fed. Sts.Middle East & North AfricaMiddle East & North Africa (excluding high income)Middle East & North Africa (IDA & IBRD countries)Middle incomeMoldovaMonacoMongoliaMontenegroMoroccoMozambiqueMyanmarNamibiaNauruNepalNetherlandsNew CaledoniaNew ZealandNicaraguaNigerNigeriaNorth AmericaNorwayOECD membersOmanOther small statesPacific island small statesPakistanPalauPanamaPapua New GuineaParaguayPeruPhilippinesPolandPortugalPost-demographic dividendPre-demographic dividendPuerto RicoQatarRomaniaRussian FederationRwandaSamoaSan MarinoSao Tome and PrincipeSaudi ArabiaSenegalSerbiaSeychellesSierra LeoneSingaporeSlovak RepublicSloveniaSmall statesSolomon IslandsSomaliaSouth AfricaSouth AsiaSouth Asia (IDA & IBRD)South SudanSpainSri LankaSt. Kitts and NevisSt. LuciaSt. Vincent and the GrenadinesSub-Saharan Africa Sub-Saharan Africa (excluding high income)Sub-Saharan Africa (IDA & IBRD countries)SudanSurinameSwazilandSwedenSwitzerlandSyrian Arab RepublicTajikistanTanzaniaThailandTimor-LesteTogoTongaTrinidad and TobagoTunisiaTurkeyTurkmenistanTuvaluUgandaUkraineUnited Arab EmiratesUnited KingdomUnited StatesUpper middle incomeUruguayUzbekistanVanuatuVenezuela, RBVietnamVirgin Islands (U.S.)West Bank and GazaWorldYemen, Rep.ZambiaZimbabwe Zeitlinie:
Diese Zeitleiste vorliegt die Graphik ab 1961 J. bis 2016 J. High income. Die Angaben bis 1960 J. sind nicht vorhanden. Die Zahl aktueller Beobachtungen nach Daten: 56.
Die Quelle (Bezeichnung):
Kennzahlen der Weltentwicklung
Die Quelle (Einrichtung):
World Bank national accounts data, and OECD National Accounts data files.
Kategorien:
Economy & Growth
Es wurde aktualisiert:
23 Apr 2017 Jahr
Kennzahlen der Wertänderungen vom Jahr zum Jahr
im Durchschnitt:
18.985 Trln
Minimum:
1.06 Trln
1 Jan 1961 Jahr
Maximum:
50.324 Trln
1 Jan 2015 Jahr
Zum Datum der Beobachtung
Wert
Absolute Veränderung
Die Veränderung bezüglich dem vorherigen Wert
1 Jan 1961 Jahr
1.06 Trln
+1.06 Trln
0.0%
1 Jan 1962 Jahr
1.122 Trln
+61.467 Mlrd.
5.8%
1 Jan 1963 Jahr
1.212 Trln
+89.739 Mlrd.
8.0%
1 Jan 1964 Jahr
1.305 Trln
+93.11 Mlrd.
7.69%
1 Jan 1965 Jahr
1.424 Trln
+119.628 Mlrd.
9.17%
1 Jan 1966 Jahr
1.547 Trln
+122.435 Mlrd.
8.6%
1 Jan 1967 Jahr
1.697 Trln
+149.854 Mlrd.
9.69%
1 Jan 1968 Jahr
1.821 Trln
+124.085 Mlrd.
7.31%
1 Jan 1969 Jahr
1.973 Trln
+152.279 Mlrd.
8.36%
1 Jan 1970 Jahr
2.166 Trln
+192.834 Mlrd.
9.77%
1 Jan 1971 Jahr
2.379 Trln
+213.736 Mlrd.
9.87%
1 Jan 1972 Jahr
2.641 Trln
+261.128 Mlrd.
10.97%
1 Jan 1973 Jahr
3.062 Trln
+421.749 Mlrd.
15.97%
1 Jan 1974 Jahr
3.704 Trln
+641.445 Mlrd.
20.95%
1 Jan 1975 Jahr
4.179 Trln
+475.518 Mlrd.
12.84%
1 Jan 1976 Jahr
4.661 Trln
+482.006 Mlrd.
11.53%
1 Jan 1977 Jahr
5.077 Trln
+416.025 Mlrd.
8.93%
1 Jan 1978 Jahr
5.749 Trln
+671.647 Mlrd.
13.23%
1 Jan 1979 Jahr
6.883 Trln
+1.134 Trln
19.73%
1 Jan 1980 Jahr
7.961 Trln
+1.078 Trln
15.66%
1 Jan 1981 Jahr
8.893 Trln
+932.257 Mlrd.
11.71%
1 Jan 1982 Jahr
9.031 Trln
+137.161 Mlrd.
1.54%
1 Jan 1983 Jahr
8.946 Trln
-84.929 Mlrd.
-0.94%
1 Jan 1984 Jahr
9.235 Trln
+289.004 Mlrd.
3.23%
1 Jan 1985 Jahr
9.632 Trln
+397.653 Mlrd.
4.31%
1 Jan 1986 Jahr
10.125 Trln
+493.089 Mlrd.
5.12%
1 Jan 1987 Jahr
12.285 Trln
+2.16 Trln
21.33%
1 Jan 1988 Jahr
14.227 Trln
+1.941 Trln
15.8%
1 Jan 1989 Jahr
16.023 Trln
+1.796 Trln
12.62%
1 Jan 1990 Jahr
16.787 Trln
+764.22 Mlrd.
4.77%
1 Jan 1991 Jahr
18.877 Trln
+2.09 Trln
12.45%
1 Jan 1992 Jahr
19.96 Trln
+1.083 Trln
5.74%
1 Jan 1993 Jahr
21.472 Trln
+1.512 Trln
7.58%
1 Jan 1994 Jahr
21.663 Trln
+190.961 Mlrd.
0.89%
1 Jan 1995 Jahr
23.272 Trln
+1.609 Trln
7.43%
1 Jan 1996 Jahr
25.841 Trln
+2.569 Trln
11.04%
1 Jan 1997 Jahr
26.075 Trln
+233.404 Mlrd.
0.9%
1 Jan 1998 Jahr
25.646 Trln
-429.013 Mlrd.
-1.65%
1 Jan 1999 Jahr
25.731 Trln
+85.23 Mlrd.
0.33%
1 Jan 2000 Jahr
27.03 Trln
+1.299 Trln
5.05%
1 Jan 2001 Jahr
27.591 Trln
+560.488 Mlrd.
2.07%
1 Jan 2002 Jahr
27.329 Trln
-262.182 Mlrd.
-0.95%
1 Jan 2003 Jahr
28.484 Trln
+1.155 Trln
4.23%
1 Jan 2004 Jahr
31.944 Trln
+3.46 Trln
12.15%
1 Jan 2005 Jahr
35.561 Trln
+3.617 Trln
11.32%
1 Jan 2006 Jahr
37.604 Trln
+2.042 Trln
5.74%
1 Jan 2007 Jahr
39.683 Trln
+2.079 Trln
5.53%
1 Jan 2008 Jahr
43.372 Trln
+3.689 Trln
9.3%
1 Jan 2009 Jahr
46.07 Trln
+2.698 Trln
6.22%
1 Jan 2010 Jahr
43.17 Trln
-2.9 Trln
-6.29%
1 Jan 2011 Jahr
45.235 Trln
+2.065 Trln
4.78%
1 Jan 2012 Jahr
48.814 Trln
+3.578 Trln
7.91%
1 Jan 2013 Jahr
48.836 Trln
+22.398 Mlrd.
0.05%
1 Jan 2014 Jahr
49.358 Trln
+521.684 Mlrd.
1.07%
1 Jan 2015 Jahr
50.324 Trln
+966.157 Mlrd.
1.96%
1 Jan 2016 Jahr
47.412 Trln
-2.912 Trln
-5.79%
Bewertung der Länder gemäß mit laufender Statistik nach Jahren


Kommentare: