29
/de/
de
AIzaSyAYiBZKx7MnpbEhh9jyipgxe19OcubqV5w
April 1, 2024
134101
France
FRA
true
2
1
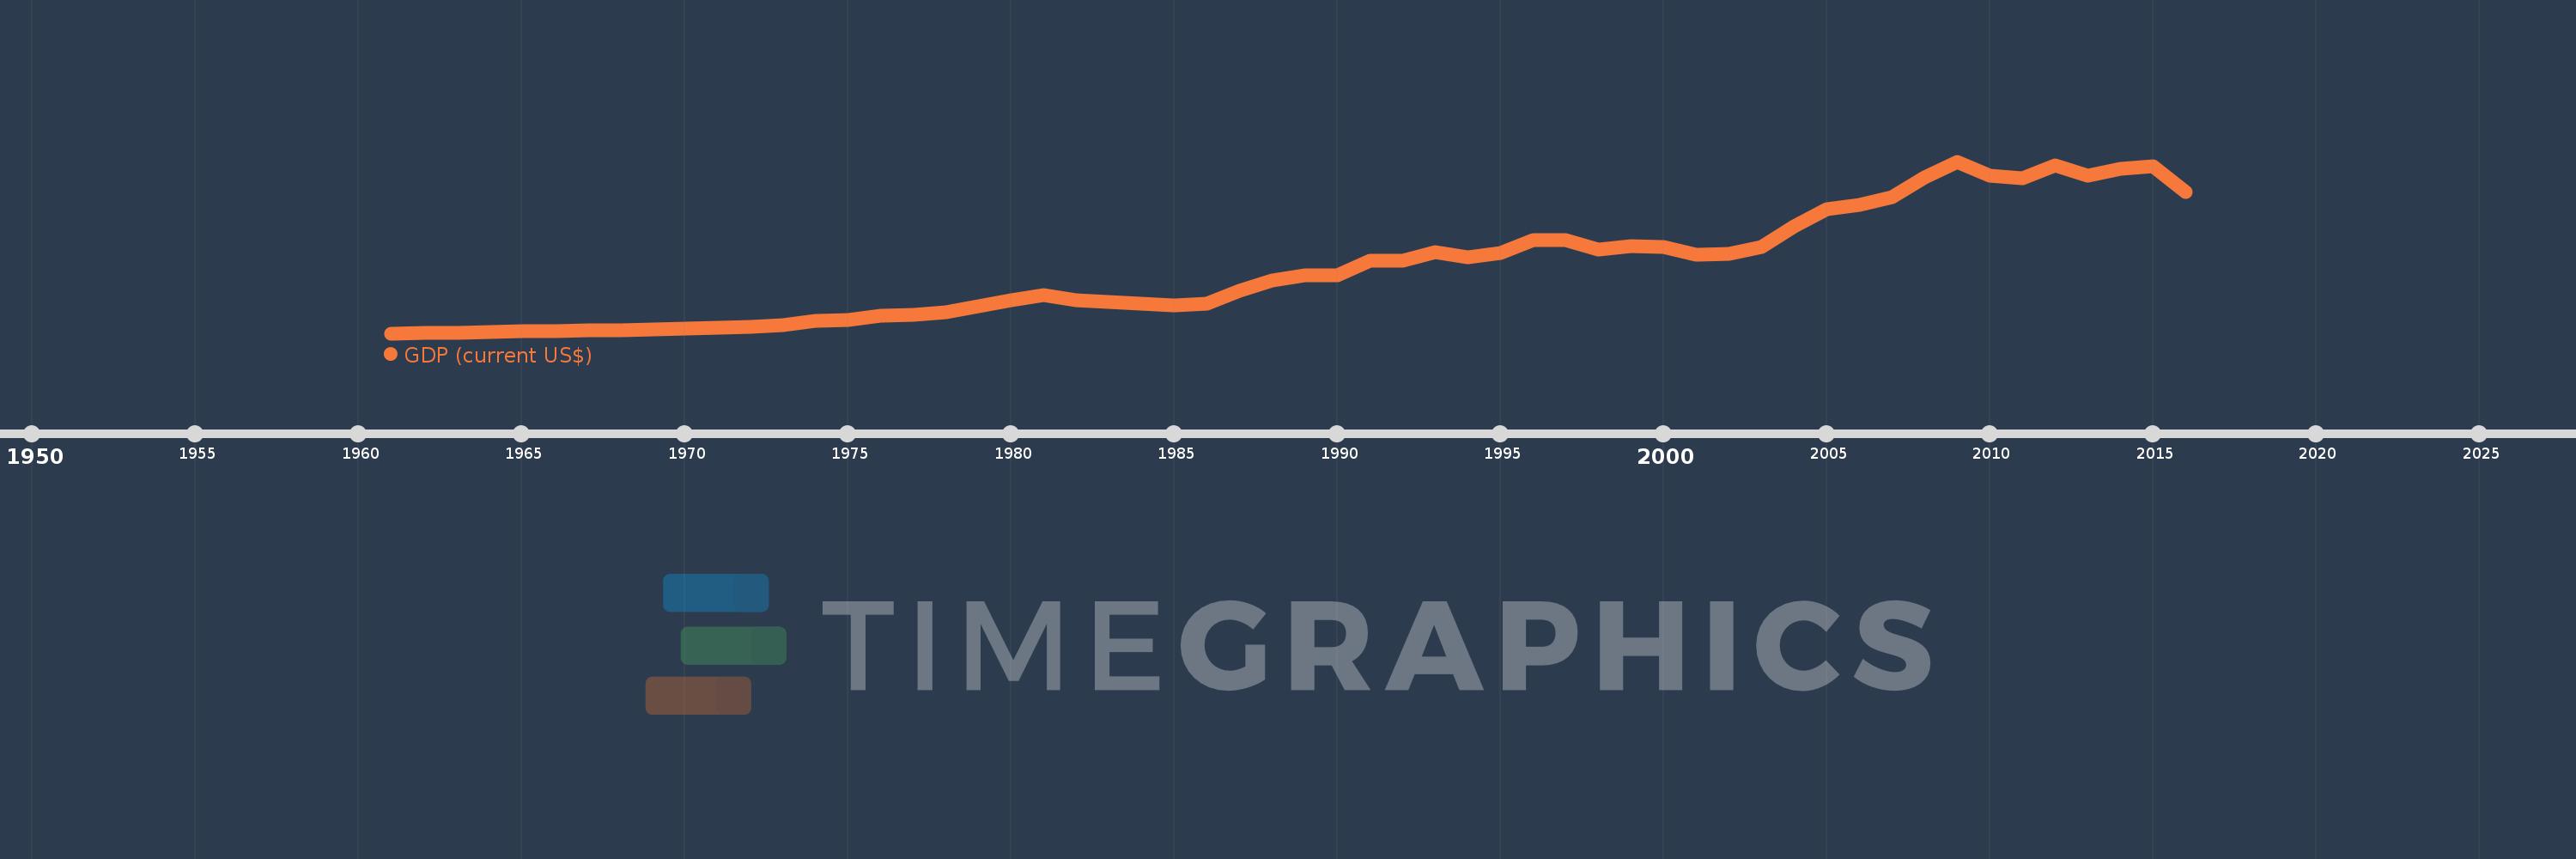
GDP (current US$)
2016,2015,2014,2013,2012,2011,2010,2009,2008,2007,2006,2005,2004,2003,2002,2001,2000,1999,1998,1997,1996,1995,1994,1993,1992,1991,1990,1989,1988,1987,1986,1985,1984,1983,1982,1981,1980,1979,1978,1977,1976,1975,1974,1973,1972,1971,1970,1969,1968,1967,1966,1965,1964,1963,1962,1961
Diese Statistik in anderen Ländern:
AfghanistanAlbaniaAlgeriaAndorraAngolaAntigua and BarbudaArab WorldArgentinaArmeniaArubaAustraliaAustriaAzerbaijanBahamas, TheBahrainBangladeshBarbadosBelarusBelgiumBelizeBeninBermudaBhutanBoliviaBosnia and HerzegovinaBotswanaBrazilBrunei DarussalamBulgariaBurkina FasoBurundiCabo VerdeCambodiaCameroonCanadaCaribbean small statesCayman IslandsCentral African RepublicCentral Europe and the BalticsChadChannel IslandsChileChinaColombiaComorosCongo, Dem. Rep.Congo, Rep.Costa RicaCote d'IvoireCroatiaCubaCyprusCzech RepublicDenmarkDjiboutiDominicaDominican RepublicEarly-demographic dividendEast Asia & PacificEast Asia & Pacific (excluding high income)East Asia & Pacific (IDA & IBRD countries)EcuadorEgypt, Arab Rep.El SalvadorEquatorial GuineaEritreaEstoniaEthiopiaEuro areaEurope & Central AsiaEurope & Central Asia (excluding high income)Europe & Central Asia (IDA & IBRD countries)European UnionFaroe IslandsFijiFinlandFragile and conflict affected situationsFranceFrench PolynesiaGabonGambia, TheGeorgiaGermanyGhanaGreeceGreenlandGrenadaGuatemalaGuineaGuinea-BissauGuyanaHaitiHeavily indebted poor countries (HIPC)High incomeHondurasHong Kong SAR, ChinaHungaryIBRD onlyIcelandIDA & IBRD totalIDA blendIDA onlyIDA totalIndiaIndonesiaIran, Islamic Rep.IraqIrelandIsle of ManIsraelItalyJamaicaJapanJordanKazakhstanKenyaKiribatiKorea, Rep.KosovoKuwaitKyrgyz RepublicLao PDRLate-demographic dividendLatin America & Caribbean Latin America & Caribbean (excluding high income)Latin America & the Caribbean (IDA & IBRD countries)LatviaLeast developed countries: UN classificationLebanonLesothoLiberiaLibyaLiechtensteinLithuaniaLow & middle incomeLow incomeLower middle incomeLuxembourgMacao SAR, ChinaMacedonia, FYRMadagascarMalawiMalaysiaMaldivesMaliMaltaMarshall IslandsMauritaniaMauritiusMexicoMicronesia, Fed. Sts.Middle East & North AfricaMiddle East & North Africa (excluding high income)Middle East & North Africa (IDA & IBRD countries)Middle incomeMoldovaMonacoMongoliaMontenegroMoroccoMozambiqueMyanmarNamibiaNauruNepalNetherlandsNew CaledoniaNew ZealandNicaraguaNigerNigeriaNorth AmericaNorwayOECD membersOmanOther small statesPacific island small statesPakistanPalauPanamaPapua New GuineaParaguayPeruPhilippinesPolandPortugalPost-demographic dividendPre-demographic dividendPuerto RicoQatarRomaniaRussian FederationRwandaSamoaSan MarinoSao Tome and PrincipeSaudi ArabiaSenegalSerbiaSeychellesSierra LeoneSingaporeSlovak RepublicSloveniaSmall statesSolomon IslandsSomaliaSouth AfricaSouth AsiaSouth Asia (IDA & IBRD)South SudanSpainSri LankaSt. Kitts and NevisSt. LuciaSt. Vincent and the GrenadinesSub-Saharan Africa Sub-Saharan Africa (excluding high income)Sub-Saharan Africa (IDA & IBRD countries)SudanSurinameSwazilandSwedenSwitzerlandSyrian Arab RepublicTajikistanTanzaniaThailandTimor-LesteTogoTongaTrinidad and TobagoTunisiaTurkeyTurkmenistanTuvaluUgandaUkraineUnited Arab EmiratesUnited KingdomUnited StatesUpper middle incomeUruguayUzbekistanVanuatuVenezuela, RBVietnamVirgin Islands (U.S.)West Bank and GazaWorldYemen, Rep.ZambiaZimbabwe Zeitlinie:
Diese Zeitleiste vorliegt die Graphik ab 1961 J. bis 2016 J. France. Die Angaben bis 1960 J. sind nicht vorhanden. Die Zahl aktueller Beobachtungen nach Daten: 56.
Die Quelle (Bezeichnung):
Kennzahlen der Weltentwicklung
Die Quelle (Einrichtung):
World Bank national accounts data, and OECD National Accounts data files.
Kategorien:
Economy & Growth
Es wurde aktualisiert:
23 Apr 2017 Jahr
Kennzahlen der Wertänderungen vom Jahr zum Jahr
im Durchschnitt:
1.131 Trln
Minimum:
62.651 Mlrd.
1 Jan 1961 Jahr
Maximum:
2.923 Trln
1 Jan 2009 Jahr
Zum Datum der Beobachtung
Wert
Absolute Veränderung
Die Veränderung bezüglich dem vorherigen Wert
1 Jan 1961 Jahr
62.651 Mlrd.
+62.651 Mlrd.
0.0%
1 Jan 1962 Jahr
68.347 Mlrd.
+5.695 Mlrd.
9.09%
1 Jan 1963 Jahr
76.314 Mlrd.
+7.967 Mlrd.
11.66%
1 Jan 1964 Jahr
85.551 Mlrd.
+9.237 Mlrd.
12.1%
1 Jan 1965 Jahr
94.907 Mlrd.
+9.355 Mlrd.
10.94%
1 Jan 1966 Jahr
102.161 Mlrd.
+7.254 Mlrd.
7.64%
1 Jan 1967 Jahr
110.597 Mlrd.
+8.437 Mlrd.
8.26%
1 Jan 1968 Jahr
119.466 Mlrd.
+8.869 Mlrd.
8.02%
1 Jan 1969 Jahr
129.847 Mlrd.
+10.381 Mlrd.
8.69%
1 Jan 1970 Jahr
140.725 Mlrd.
+10.878 Mlrd.
8.38%
1 Jan 1971 Jahr
148.949 Mlrd.
+8.223 Mlrd.
5.84%
1 Jan 1972 Jahr
166.564 Mlrd.
+17.616 Mlrd.
11.83%
1 Jan 1973 Jahr
204.283 Mlrd.
+37.719 Mlrd.
22.65%
1 Jan 1974 Jahr
265.382 Mlrd.
+61.098 Mlrd.
29.91%
1 Jan 1975 Jahr
286.526 Mlrd.
+21.145 Mlrd.
7.97%
1 Jan 1976 Jahr
362.001 Mlrd.
+75.475 Mlrd.
26.34%
1 Jan 1977 Jahr
373.41 Mlrd.
+11.409 Mlrd.
3.15%
1 Jan 1978 Jahr
411.464 Mlrd.
+38.054 Mlrd.
10.19%
1 Jan 1979 Jahr
508.183 Mlrd.
+96.719 Mlrd.
23.51%
1 Jan 1980 Jahr
615.834 Mlrd.
+107.651 Mlrd.
21.18%
1 Jan 1981 Jahr
703.525 Mlrd.
+87.691 Mlrd.
14.24%
1 Jan 1982 Jahr
617.59 Mlrd.
-85.936 Mlrd.
-12.22%
1 Jan 1983 Jahr
586.837 Mlrd.
-30.753 Mlrd.
-4.98%
1 Jan 1984 Jahr
561.852 Mlrd.
-24.985 Mlrd.
-4.26%
1 Jan 1985 Jahr
532.649 Mlrd.
-29.203 Mlrd.
-5.2%
1 Jan 1986 Jahr
555.197 Mlrd.
+22.548 Mlrd.
4.23%
1 Jan 1987 Jahr
774.556 Mlrd.
+219.359 Mlrd.
39.51%
1 Jan 1988 Jahr
938.368 Mlrd.
+163.812 Mlrd.
21.15%
1 Jan 1989 Jahr
1.024 Trln
+85.136 Mlrd.
9.07%
1 Jan 1990 Jahr
1.03 Trln
+6.618 Mlrd.
0.65%
1 Jan 1991 Jahr
1.275 Trln
+245.178 Mlrd.
23.8%
1 Jan 1992 Jahr
1.276 Trln
+262.74 Mln.
0.02%
1 Jan 1993 Jahr
1.409 Trln
+133.162 Mlrd.
10.44%
1 Jan 1994 Jahr
1.33 Trln
-78.63 Mlrd.
-5.58%
1 Jan 1995 Jahr
1.402 Trln
+71.541 Mlrd.
5.38%
1 Jan 1996 Jahr
1.61 Trln
+208.256 Mlrd.
14.86%
1 Jan 1997 Jahr
1.614 Trln
+4.353 Mlrd.
0.27%
1 Jan 1998 Jahr
1.461 Trln
-153.536 Mlrd.
-9.51%
1 Jan 1999 Jahr
1.511 Trln
+50.049 Mlrd.
3.43%
1 Jan 2000 Jahr
1.5 Trln
-10.482 Mlrd.
-0.69%
1 Jan 2001 Jahr
1.368 Trln
-131.838 Mlrd.
-8.79%
1 Jan 2002 Jahr
1.382 Trln
+13.78 Mlrd.
1.01%
1 Jan 2003 Jahr
1.5 Trln
+118.12 Mlrd.
8.55%
1 Jan 2004 Jahr
1.848 Trln
+347.786 Mlrd.
23.18%
1 Jan 2005 Jahr
2.124 Trln
+275.988 Mlrd.
14.93%
1 Jan 2006 Jahr
2.204 Trln
+79.566 Mlrd.
3.75%
1 Jan 2007 Jahr
2.325 Trln
+121.333 Mlrd.
5.51%
1 Jan 2008 Jahr
2.663 Trln
+338.101 Mlrd.
14.54%
1 Jan 2009 Jahr
2.923 Trln
+260.353 Mlrd.
9.78%
1 Jan 2010 Jahr
2.694 Trln
-229.638 Mlrd.
-7.85%
1 Jan 2011 Jahr
2.647 Trln
-46.833 Mlrd.
-1.74%
1 Jan 2012 Jahr
2.863 Trln
+215.507 Mlrd.
8.14%
1 Jan 2013 Jahr
2.681 Trln
-181.086 Mlrd.
-6.33%
1 Jan 2014 Jahr
2.809 Trln
+127.095 Mlrd.
4.74%
1 Jan 2015 Jahr
2.839 Trln
+30.651 Mlrd.
1.09%
1 Jan 2016 Jahr
2.419 Trln
-420.327 Mlrd.
-14.8%
Bewertung der Länder gemäß mit laufender Statistik nach Jahren


Kommentare: