29
/de/
de
AIzaSyAYiBZKx7MnpbEhh9jyipgxe19OcubqV5w
April 1, 2024
49421
Middle East & North Africa (excluding high income)
MNA
false
2
1
Population, total
2016,2015,2014,2013,2012,2011,2010,2009,2008,2007,2006,2005,2004,2003,2002,2001,2000,1999,1998,1997,1996,1995,1994,1993,1992,1991,1990,1989,1988,1987,1986,1985,1984,1983,1982,1981,1980,1979,1978,1977,1976,1975,1974,1973,1972,1971,1970,1969,1968,1967,1966,1965,1964,1963,1962,1961
Diese Statistik in anderen Ländern:
AfghanistanAlbaniaAlgeriaAmerican SamoaAndorraAngolaAntigua and BarbudaArab WorldArgentinaArmeniaArubaAustraliaAustriaAzerbaijanBahamas, TheBahrainBangladeshBarbadosBelarusBelgiumBelizeBeninBermudaBhutanBoliviaBosnia and HerzegovinaBotswanaBrazilBritish Virgin IslandsBrunei DarussalamBulgariaBurkina FasoBurundiCabo VerdeCambodiaCameroonCanadaCaribbean small statesCayman IslandsCentral African RepublicCentral Europe and the BalticsChadChannel IslandsChileChinaColombiaComorosCongo, Dem. Rep.Congo, Rep.Costa RicaCote d'IvoireCroatiaCubaCuracaoCyprusCzech RepublicDenmarkDjiboutiDominicaDominican RepublicEarly-demographic dividendEast Asia & PacificEast Asia & Pacific (excluding high income)East Asia & Pacific (IDA & IBRD countries)EcuadorEgypt, Arab Rep.El SalvadorEquatorial GuineaEritreaEstoniaEthiopiaEuro areaEurope & Central AsiaEurope & Central Asia (excluding high income)Europe & Central Asia (IDA & IBRD countries)European UnionFaroe IslandsFijiFinlandFragile and conflict affected situationsFranceFrench PolynesiaGabonGambia, TheGeorgiaGermanyGhanaGibraltarGreeceGreenlandGrenadaGuamGuatemalaGuineaGuinea-BissauGuyanaHaitiHeavily indebted poor countries (HIPC)High incomeHondurasHong Kong SAR, ChinaHungaryIBRD onlyIcelandIDA & IBRD totalIDA blendIDA onlyIDA totalIndiaIndonesiaIran, Islamic Rep.IraqIrelandIsle of ManIsraelItalyJamaicaJapanJordanKazakhstanKenyaKiribatiKorea, Dem. People’s Rep.Korea, Rep.KosovoKuwaitKyrgyz RepublicLao PDRLate-demographic dividendLatin America & Caribbean Latin America & Caribbean (excluding high income)Latin America & the Caribbean (IDA & IBRD countries)LatviaLeast developed countries: UN classificationLebanonLesothoLiberiaLibyaLiechtensteinLithuaniaLow & middle incomeLow incomeLower middle incomeLuxembourgMacao SAR, ChinaMacedonia, FYRMadagascarMalawiMalaysiaMaldivesMaliMaltaMarshall IslandsMauritaniaMauritiusMexicoMicronesia, Fed. Sts.Middle East & North AfricaMiddle East & North Africa (excluding high income)Middle East & North Africa (IDA & IBRD countries)Middle incomeMoldovaMonacoMongoliaMontenegroMoroccoMozambiqueMyanmarNamibiaNauruNepalNetherlandsNew CaledoniaNew ZealandNicaraguaNigerNigeriaNorth AmericaNorthern Mariana IslandsNorwayOECD membersOmanOther small statesPacific island small statesPakistanPalauPanamaPapua New GuineaParaguayPeruPhilippinesPolandPortugalPost-demographic dividendPre-demographic dividendPuerto RicoQatarRomaniaRussian FederationRwandaSamoaSan MarinoSao Tome and PrincipeSaudi ArabiaSenegalSerbiaSeychellesSierra LeoneSingaporeSint Maarten (Dutch part)Slovak RepublicSloveniaSmall statesSolomon IslandsSomaliaSouth AfricaSouth AsiaSouth Asia (IDA & IBRD)South SudanSpainSri LankaSt. Kitts and NevisSt. LuciaSt. Martin (French part)St. Vincent and the GrenadinesSub-Saharan Africa Sub-Saharan Africa (excluding high income)Sub-Saharan Africa (IDA & IBRD countries)SudanSurinameSwazilandSwedenSwitzerlandSyrian Arab RepublicTajikistanTanzaniaThailandTimor-LesteTogoTongaTrinidad and TobagoTunisiaTurkeyTurkmenistanTurks and Caicos IslandsTuvaluUgandaUkraineUnited Arab EmiratesUnited KingdomUnited StatesUpper middle incomeUruguayUzbekistanVanuatuVenezuela, RBVietnamVirgin Islands (U.S.)West Bank and GazaWorldYemen, Rep.ZambiaZimbabwe Zeitlinie:
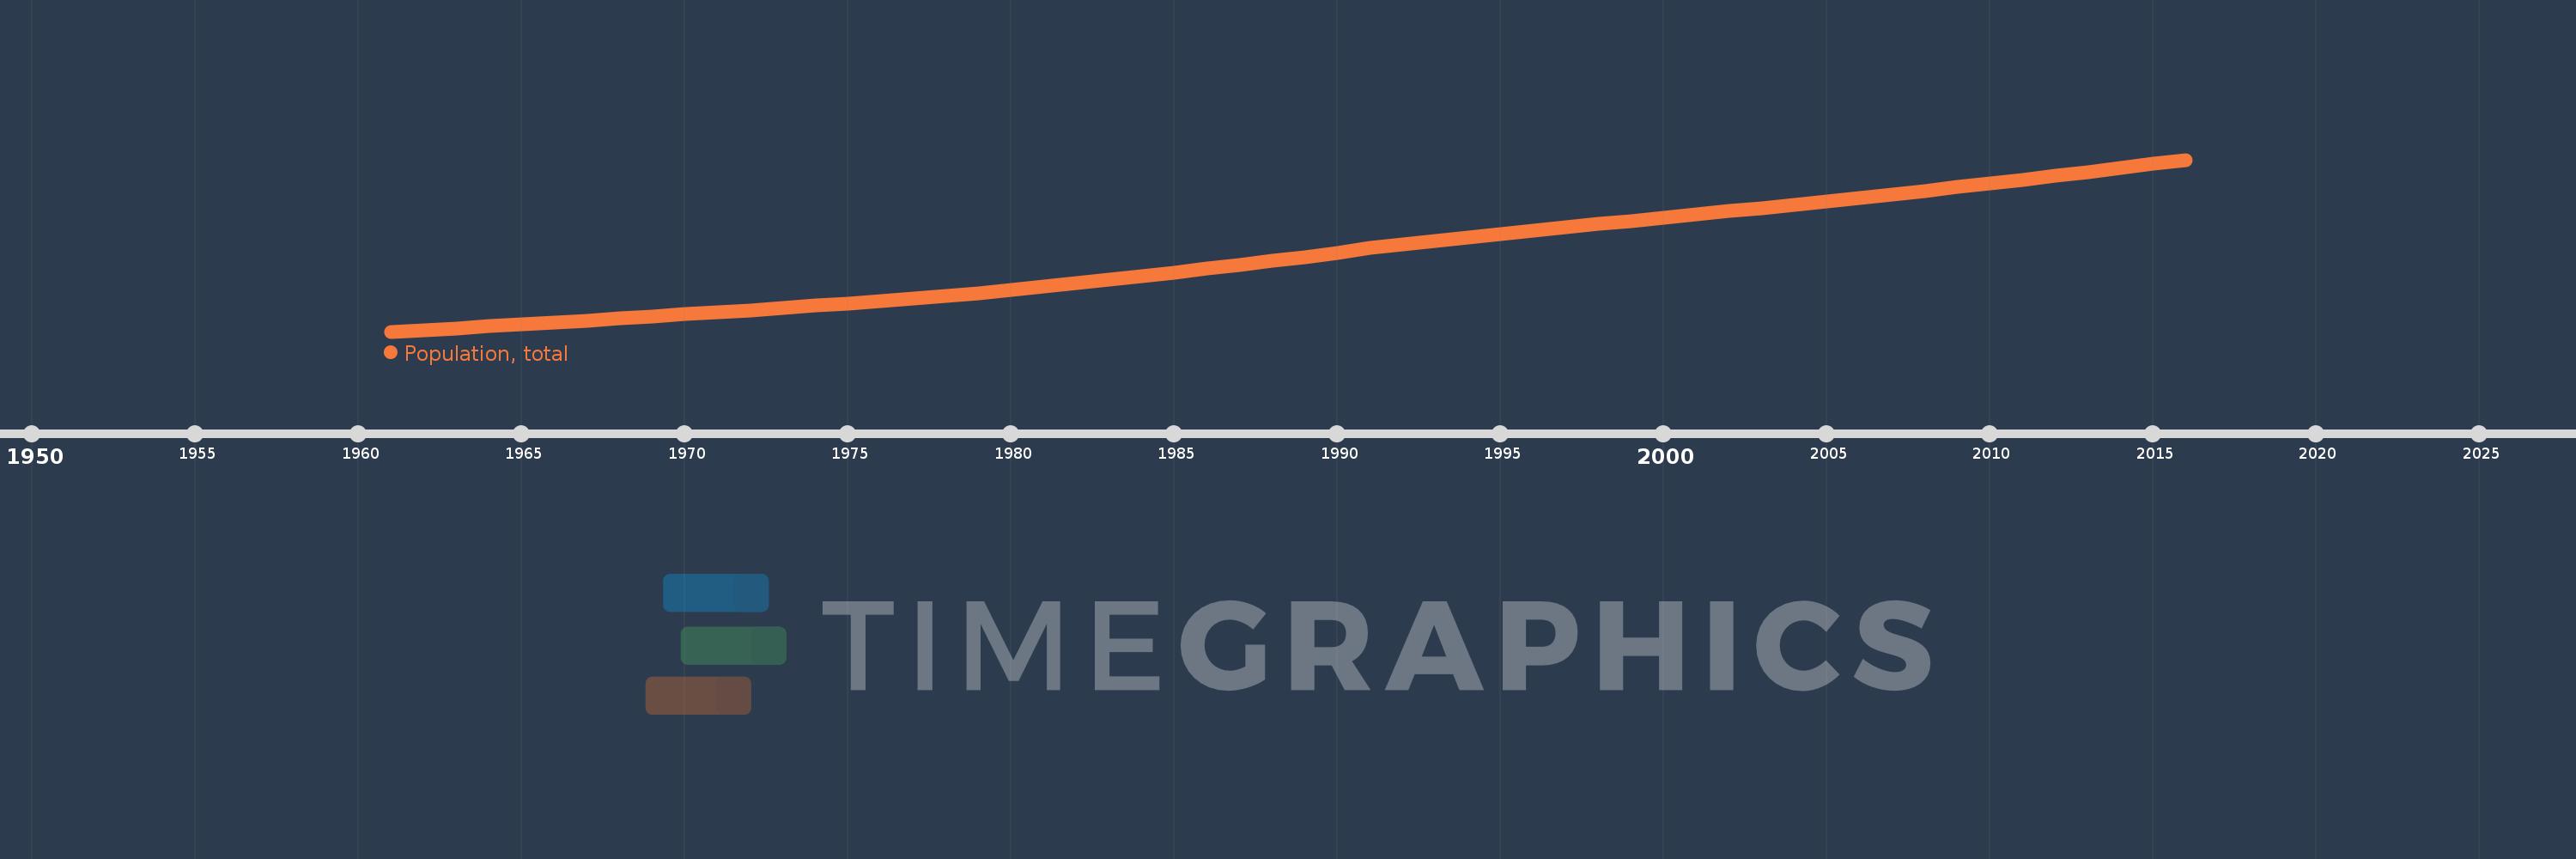
Diese Zeitleiste vorliegt die Graphik ab 1961 J. bis 2016 J. Middle East & North Africa (excluding high income). Die Angaben bis 1960 J. sind nicht vorhanden. Die Zahl aktueller Beobachtungen nach Daten: 56.
Die Quelle (Bezeichnung):
Kennzahlen der Weltentwicklung
Die Quelle (Einrichtung):
(1) United Nations Population Division. World Population Prospects, (2) Census reports and other statistical publications from national statistical offices, (3) Eurostat: Demographic Statistics, (4) United Nations Statistical Division. Population and Vital Statistics Report (various years), (5) U.S. Census Bureau: International Database, and (6) Secretariat of the Pacific Community: Statistics and Demography Programme.
Kategorien:
Climate Change, Health
Es wurde aktualisiert:
23 Apr 2017 Jahr
Kennzahlen der Wertänderungen vom Jahr zum Jahr
im Durchschnitt:
215.522 Mln.
Minimum:
97.914 Mln.
1 Jan 1961 Jahr
Maximum:
362.561 Mln.
1 Jan 2016 Jahr
Zum Datum der Beobachtung
Wert
Absolute Veränderung
Die Veränderung bezüglich dem vorherigen Wert
1 Jan 1961 Jahr
97.914 Mln.
+97.914 Mln.
0.0%
1 Jan 1962 Jahr
100.52 Mln.
+2.606 Mln.
2.66%
1 Jan 1963 Jahr
103.203 Mln.
+2.683 Mln.
2.67%
1 Jan 1964 Jahr
105.968 Mln.
+2.765 Mln.
2.68%
1 Jan 1965 Jahr
108.822 Mln.
+2.854 Mln.
2.69%
1 Jan 1966 Jahr
111.771 Mln.
+2.949 Mln.
2.71%
1 Jan 1967 Jahr
114.823 Mln.
+3.052 Mln.
2.73%
1 Jan 1968 Jahr
117.971 Mln.
+3.148 Mln.
2.74%
1 Jan 1969 Jahr
121.19 Mln.
+3.219 Mln.
2.73%
1 Jan 1970 Jahr
124.446 Mln.
+3.256 Mln.
2.69%
1 Jan 1971 Jahr
127.718 Mln.
+3.272 Mln.
2.63%
1 Jan 1972 Jahr
130.99 Mln.
+3.271 Mln.
2.56%
1 Jan 1973 Jahr
134.302 Mln.
+3.312 Mln.
2.53%
1 Jan 1974 Jahr
137.7 Mln.
+3.398 Mln.
2.53%
1 Jan 1975 Jahr
141.243 Mln.
+3.543 Mln.
2.57%
1 Jan 1976 Jahr
144.979 Mln.
+3.736 Mln.
2.65%
1 Jan 1977 Jahr
148.915 Mln.
+3.936 Mln.
2.71%
1 Jan 1978 Jahr
153.053 Mln.
+4.138 Mln.
2.78%
1 Jan 1979 Jahr
157.419 Mln.
+4.366 Mln.
2.85%
1 Jan 1980 Jahr
162.042 Mln.
+4.623 Mln.
2.94%
1 Jan 1981 Jahr
166.937 Mln.
+4.895 Mln.
3.02%
1 Jan 1982 Jahr
172.106 Mln.
+5.17 Mln.
3.1%
1 Jan 1983 Jahr
177.528 Mln.
+5.422 Mln.
3.15%
1 Jan 1984 Jahr
183.16 Mln.
+5.632 Mln.
3.17%
1 Jan 1985 Jahr
188.904 Mln.
+5.745 Mln.
3.14%
1 Jan 1986 Jahr
194.828 Mln.
+5.924 Mln.
3.14%
1 Jan 1987 Jahr
200.858 Mln.
+6.03 Mln.
3.09%
1 Jan 1988 Jahr
206.918 Mln.
+6.059 Mln.
3.02%
1 Jan 1989 Jahr
212.943 Mln.
+6.026 Mln.
2.91%
1 Jan 1990 Jahr
218.78 Mln.
+5.837 Mln.
2.74%
1 Jan 1991 Jahr
226.501 Mln.
+7.721 Mln.
3.53%
1 Jan 1992 Jahr
232.072 Mln.
+5.571 Mln.
2.46%
1 Jan 1993 Jahr
237.442 Mln.
+5.37 Mln.
2.31%
1 Jan 1994 Jahr
242.574 Mln.
+5.132 Mln.
2.16%
1 Jan 1995 Jahr
247.782 Mln.
+5.207 Mln.
2.15%
1 Jan 1996 Jahr
252.96 Mln.
+5.179 Mln.
2.09%
1 Jan 1997 Jahr
258.137 Mln.
+5.177 Mln.
2.05%
1 Jan 1998 Jahr
263.331 Mln.
+5.193 Mln.
2.01%
1 Jan 1999 Jahr
268.465 Mln.
+5.134 Mln.
1.95%
1 Jan 2000 Jahr
273.565 Mln.
+5.1 Mln.
1.9%
1 Jan 2001 Jahr
278.581 Mln.
+5.016 Mln.
1.83%
1 Jan 2002 Jahr
283.534 Mln.
+4.954 Mln.
1.78%
1 Jan 2003 Jahr
288.455 Mln.
+4.92 Mln.
1.74%
1 Jan 2004 Jahr
293.391 Mln.
+4.936 Mln.
1.71%
1 Jan 2005 Jahr
298.427 Mln.
+5.037 Mln.
1.72%
1 Jan 2006 Jahr
303.622 Mln.
+5.195 Mln.
1.74%
1 Jan 2007 Jahr
308.995 Mln.
+5.373 Mln.
1.77%
1 Jan 2008 Jahr
314.531 Mln.
+5.536 Mln.
1.79%
1 Jan 2009 Jahr
320.229 Mln.
+5.698 Mln.
1.81%
1 Jan 2010 Jahr
326.041 Mln.
+5.812 Mln.
1.81%
1 Jan 2011 Jahr
331.929 Mln.
+5.888 Mln.
1.81%
1 Jan 2012 Jahr
337.908 Mln.
+5.98 Mln.
1.8%
1 Jan 2013 Jahr
343.94 Mln.
+6.032 Mln.
1.79%
1 Jan 2014 Jahr
350.057 Mln.
+6.116 Mln.
1.78%
1 Jan 2015 Jahr
356.263 Mln.
+6.206 Mln.
1.77%
1 Jan 2016 Jahr
362.561 Mln.
+6.298 Mln.
1.77%
Bewertung der Länder gemäß mit laufender Statistik nach Jahren


Kommentare: