29
/de/
de
AIzaSyAYiBZKx7MnpbEhh9jyipgxe19OcubqV5w
April 1, 2024
252307
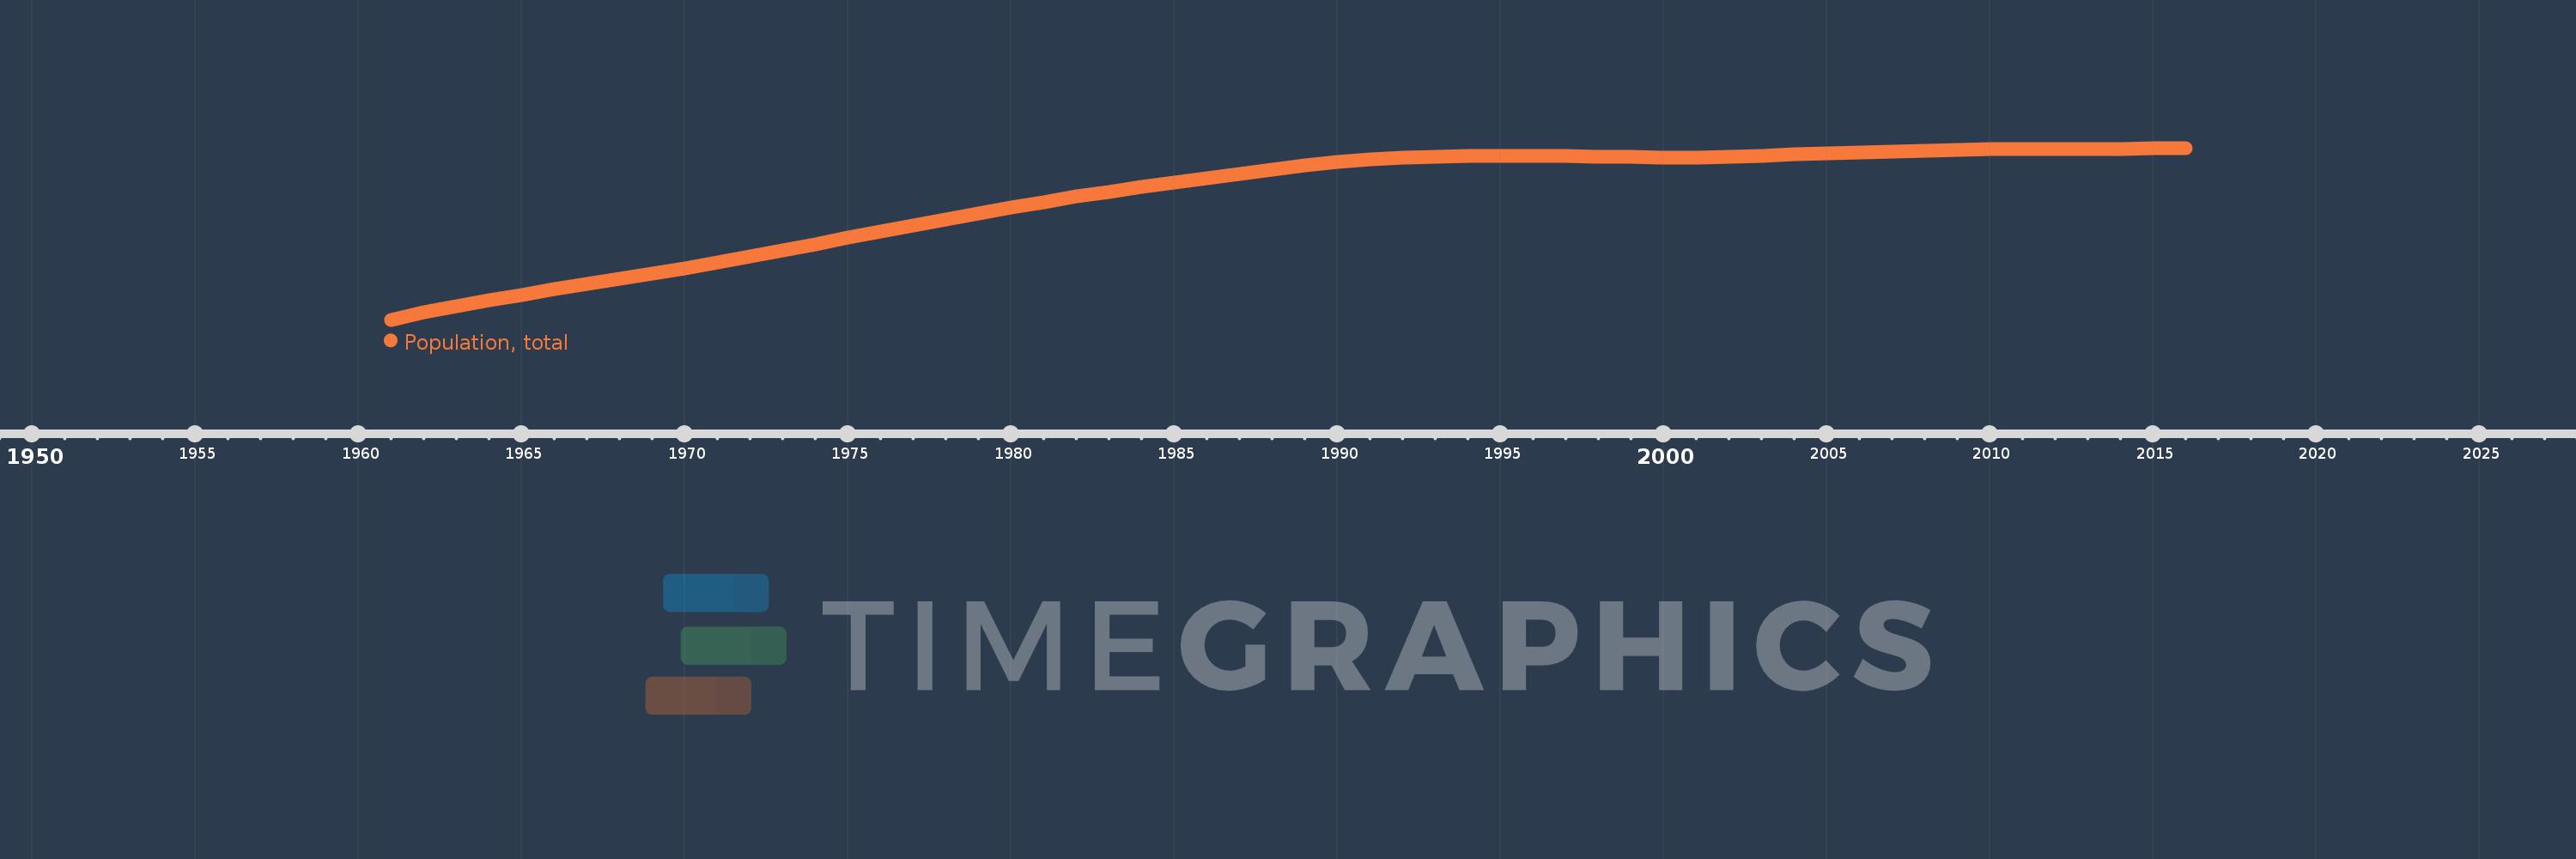
St. Vincent and the Grenadines
VCT
true
2
1
Population, total
2016,2015,2014,2013,2012,2011,2010,2009,2008,2007,2006,2005,2004,2003,2002,2001,2000,1999,1998,1997,1996,1995,1994,1993,1992,1991,1990,1989,1988,1987,1986,1985,1984,1983,1982,1981,1980,1979,1978,1977,1976,1975,1974,1973,1972,1971,1970,1969,1968,1967,1966,1965,1964,1963,1962,1961
Diese Statistik in anderen Ländern:
AfghanistanAlbaniaAlgeriaAmerican SamoaAndorraAngolaAntigua and BarbudaArab WorldArgentinaArmeniaArubaAustraliaAustriaAzerbaijanBahamas, TheBahrainBangladeshBarbadosBelarusBelgiumBelizeBeninBermudaBhutanBoliviaBosnia and HerzegovinaBotswanaBrazilBritish Virgin IslandsBrunei DarussalamBulgariaBurkina FasoBurundiCabo VerdeCambodiaCameroonCanadaCaribbean small statesCayman IslandsCentral African RepublicCentral Europe and the BalticsChadChannel IslandsChileChinaColombiaComorosCongo, Dem. Rep.Congo, Rep.Costa RicaCote d'IvoireCroatiaCubaCuracaoCyprusCzech RepublicDenmarkDjiboutiDominicaDominican RepublicEarly-demographic dividendEast Asia & PacificEast Asia & Pacific (excluding high income)East Asia & Pacific (IDA & IBRD countries)EcuadorEgypt, Arab Rep.El SalvadorEquatorial GuineaEritreaEstoniaEthiopiaEuro areaEurope & Central AsiaEurope & Central Asia (excluding high income)Europe & Central Asia (IDA & IBRD countries)European UnionFaroe IslandsFijiFinlandFragile and conflict affected situationsFranceFrench PolynesiaGabonGambia, TheGeorgiaGermanyGhanaGibraltarGreeceGreenlandGrenadaGuamGuatemalaGuineaGuinea-BissauGuyanaHaitiHeavily indebted poor countries (HIPC)High incomeHondurasHong Kong SAR, ChinaHungaryIBRD onlyIcelandIDA & IBRD totalIDA blendIDA onlyIDA totalIndiaIndonesiaIran, Islamic Rep.IraqIrelandIsle of ManIsraelItalyJamaicaJapanJordanKazakhstanKenyaKiribatiKorea, Dem. People’s Rep.Korea, Rep.KosovoKuwaitKyrgyz RepublicLao PDRLate-demographic dividendLatin America & Caribbean Latin America & Caribbean (excluding high income)Latin America & the Caribbean (IDA & IBRD countries)LatviaLeast developed countries: UN classificationLebanonLesothoLiberiaLibyaLiechtensteinLithuaniaLow & middle incomeLow incomeLower middle incomeLuxembourgMacao SAR, ChinaMacedonia, FYRMadagascarMalawiMalaysiaMaldivesMaliMaltaMarshall IslandsMauritaniaMauritiusMexicoMicronesia, Fed. Sts.Middle East & North AfricaMiddle East & North Africa (excluding high income)Middle East & North Africa (IDA & IBRD countries)Middle incomeMoldovaMonacoMongoliaMontenegroMoroccoMozambiqueMyanmarNamibiaNauruNepalNetherlandsNew CaledoniaNew ZealandNicaraguaNigerNigeriaNorth AmericaNorthern Mariana IslandsNorwayOECD membersOmanOther small statesPacific island small statesPakistanPalauPanamaPapua New GuineaParaguayPeruPhilippinesPolandPortugalPost-demographic dividendPre-demographic dividendPuerto RicoQatarRomaniaRussian FederationRwandaSamoaSan MarinoSao Tome and PrincipeSaudi ArabiaSenegalSerbiaSeychellesSierra LeoneSingaporeSint Maarten (Dutch part)Slovak RepublicSloveniaSmall statesSolomon IslandsSomaliaSouth AfricaSouth AsiaSouth Asia (IDA & IBRD)South SudanSpainSri LankaSt. Kitts and NevisSt. LuciaSt. Martin (French part)St. Vincent and the GrenadinesSub-Saharan Africa Sub-Saharan Africa (excluding high income)Sub-Saharan Africa (IDA & IBRD countries)SudanSurinameSwazilandSwedenSwitzerlandSyrian Arab RepublicTajikistanTanzaniaThailandTimor-LesteTogoTongaTrinidad and TobagoTunisiaTurkeyTurkmenistanTurks and Caicos IslandsTuvaluUgandaUkraineUnited Arab EmiratesUnited KingdomUnited StatesUpper middle incomeUruguayUzbekistanVanuatuVenezuela, RBVietnamVirgin Islands (U.S.)West Bank and GazaWorldYemen, Rep.ZambiaZimbabwe Zeitlinie:
Diese Zeitleiste vorliegt die Graphik ab 1961 J. bis 2016 J. St. Vincent and the Grenadines. Die Angaben bis 1960 J. sind nicht vorhanden. Die Zahl aktueller Beobachtungen nach Daten: 56.
Die Quelle (Bezeichnung):
Kennzahlen der Weltentwicklung
Die Quelle (Einrichtung):
(1) United Nations Population Division. World Population Prospects, (2) Census reports and other statistical publications from national statistical offices, (3) Eurostat: Demographic Statistics, (4) United Nations Statistical Division. Population and Vital Statistics Report (various years), (5) U.S. Census Bureau: International Database, and (6) Secretariat of the Pacific Community: Statistics and Demography Programme.
Kategorien:
Climate Change, Health
Es wurde aktualisiert:
23 Apr 2017 Jahr
Kennzahlen der Wertänderungen vom Jahr zum Jahr
im Durchschnitt:
101.189 Tsnd.
Minimum:
80.948 Tsnd.
1 Jan 1961 Jahr
Maximum:
109.462 Tsnd.
1 Jan 2016 Jahr
Zum Datum der Beobachtung
Wert
Absolute Veränderung
Die Veränderung bezüglich dem vorherigen Wert
1 Jan 1961 Jahr
80.948 Tsnd.
+80.948 Tsnd.
0.0%
1 Jan 1962 Jahr
82.144 Tsnd.
+1.196 Tsnd.
1.48%
1 Jan 1963 Jahr
83.206 Tsnd.
+1.062 Tsnd.
1.29%
1 Jan 1964 Jahr
84.167 Tsnd.
+961.0
1.15%
1 Jan 1965 Jahr
85.076 Tsnd.
+909.0
1.08%
1 Jan 1966 Jahr
85.972 Tsnd.
+896.0
1.05%
1 Jan 1967 Jahr
86.86 Tsnd.
+888.0
1.03%
1 Jan 1968 Jahr
87.736 Tsnd.
+876.0
1.01%
1 Jan 1969 Jahr
88.615 Tsnd.
+879.0
1.0%
1 Jan 1970 Jahr
89.518 Tsnd.
+903.0
1.02%
1 Jan 1971 Jahr
90.457 Tsnd.
+939.0
1.05%
1 Jan 1972 Jahr
91.44 Tsnd.
+983.0
1.09%
1 Jan 1973 Jahr
92.465 Tsnd.
+1.025 Tsnd.
1.12%
1 Jan 1974 Jahr
93.516 Tsnd.
+1.051 Tsnd.
1.14%
1 Jan 1975 Jahr
94.572 Tsnd.
+1.056 Tsnd.
1.13%
1 Jan 1976 Jahr
95.614 Tsnd.
+1.042 Tsnd.
1.1%
1 Jan 1977 Jahr
96.639 Tsnd.
+1.025 Tsnd.
1.07%
1 Jan 1978 Jahr
97.649 Tsnd.
+1.01 Tsnd.
1.05%
1 Jan 1979 Jahr
98.634 Tsnd.
+985.0
1.01%
1 Jan 1980 Jahr
99.589 Tsnd.
+955.0
0.97%
1 Jan 1981 Jahr
100.506 Tsnd.
+917.0
0.92%
1 Jan 1982 Jahr
101.378 Tsnd.
+872.0
0.87%
1 Jan 1983 Jahr
102.202 Tsnd.
+824.0
0.81%
1 Jan 1984 Jahr
102.985 Tsnd.
+783.0
0.77%
1 Jan 1985 Jahr
103.742 Tsnd.
+757.0
0.74%
1 Jan 1986 Jahr
104.477 Tsnd.
+735.0
0.71%
1 Jan 1987 Jahr
105.197 Tsnd.
+720.0
0.69%
1 Jan 1988 Jahr
105.892 Tsnd.
+695.0
0.66%
1 Jan 1989 Jahr
106.533 Tsnd.
+641.0
0.61%
1 Jan 1990 Jahr
107.081 Tsnd.
+548.0
0.51%
1 Jan 1991 Jahr
107.509 Tsnd.
+428.0
0.4%
1 Jan 1992 Jahr
107.811 Tsnd.
+302.0
0.28%
1 Jan 1993 Jahr
108.001 Tsnd.
+190.0
0.18%
1 Jan 1994 Jahr
108.097 Tsnd.
+96.0
0.09%
1 Jan 1995 Jahr
108.129 Tsnd.
+32.0
0.03%
1 Jan 1996 Jahr
108.122 Tsnd.
-7.0
-0.01%
1 Jan 1997 Jahr
108.078 Tsnd.
-44.0
-0.04%
1 Jan 1998 Jahr
108.001 Tsnd.
-77.0
-0.07%
1 Jan 1999 Jahr
107.923 Tsnd.
-78.0
-0.07%
1 Jan 2000 Jahr
107.879 Tsnd.
-44.0
-0.04%
1 Jan 2001 Jahr
107.897 Tsnd.
+18.0
0.02%
1 Jan 2002 Jahr
107.989 Tsnd.
+92.0
0.09%
1 Jan 2003 Jahr
108.15 Tsnd.
+161.0
0.15%
1 Jan 2004 Jahr
108.354 Tsnd.
+204.0
0.19%
1 Jan 2005 Jahr
108.563 Tsnd.
+209.0
0.19%
1 Jan 2006 Jahr
108.749 Tsnd.
+186.0
0.17%
1 Jan 2007 Jahr
108.908 Tsnd.
+159.0
0.15%
1 Jan 2008 Jahr
109.049 Tsnd.
+141.0
0.13%
1 Jan 2009 Jahr
109.165 Tsnd.
+116.0
0.11%
1 Jan 2010 Jahr
109.255 Tsnd.
+90.0
0.08%
1 Jan 2011 Jahr
109.316 Tsnd.
+61.0
0.06%
1 Jan 2012 Jahr
109.341 Tsnd.
+25.0
0.02%
1 Jan 2013 Jahr
109.334 Tsnd.
-7.0
-0.01%
1 Jan 2014 Jahr
109.327 Tsnd.
-7.0
-0.01%
1 Jan 2015 Jahr
109.36 Tsnd.
+33.0
0.03%
1 Jan 2016 Jahr
109.462 Tsnd.
+102.0
0.09%
Bewertung der Länder gemäß mit laufender Statistik nach Jahren


Kommentare: