29
/de/
de
AIzaSyAYiBZKx7MnpbEhh9jyipgxe19OcubqV5w
April 1, 2024
217730
Palau
PLW
true
2
1
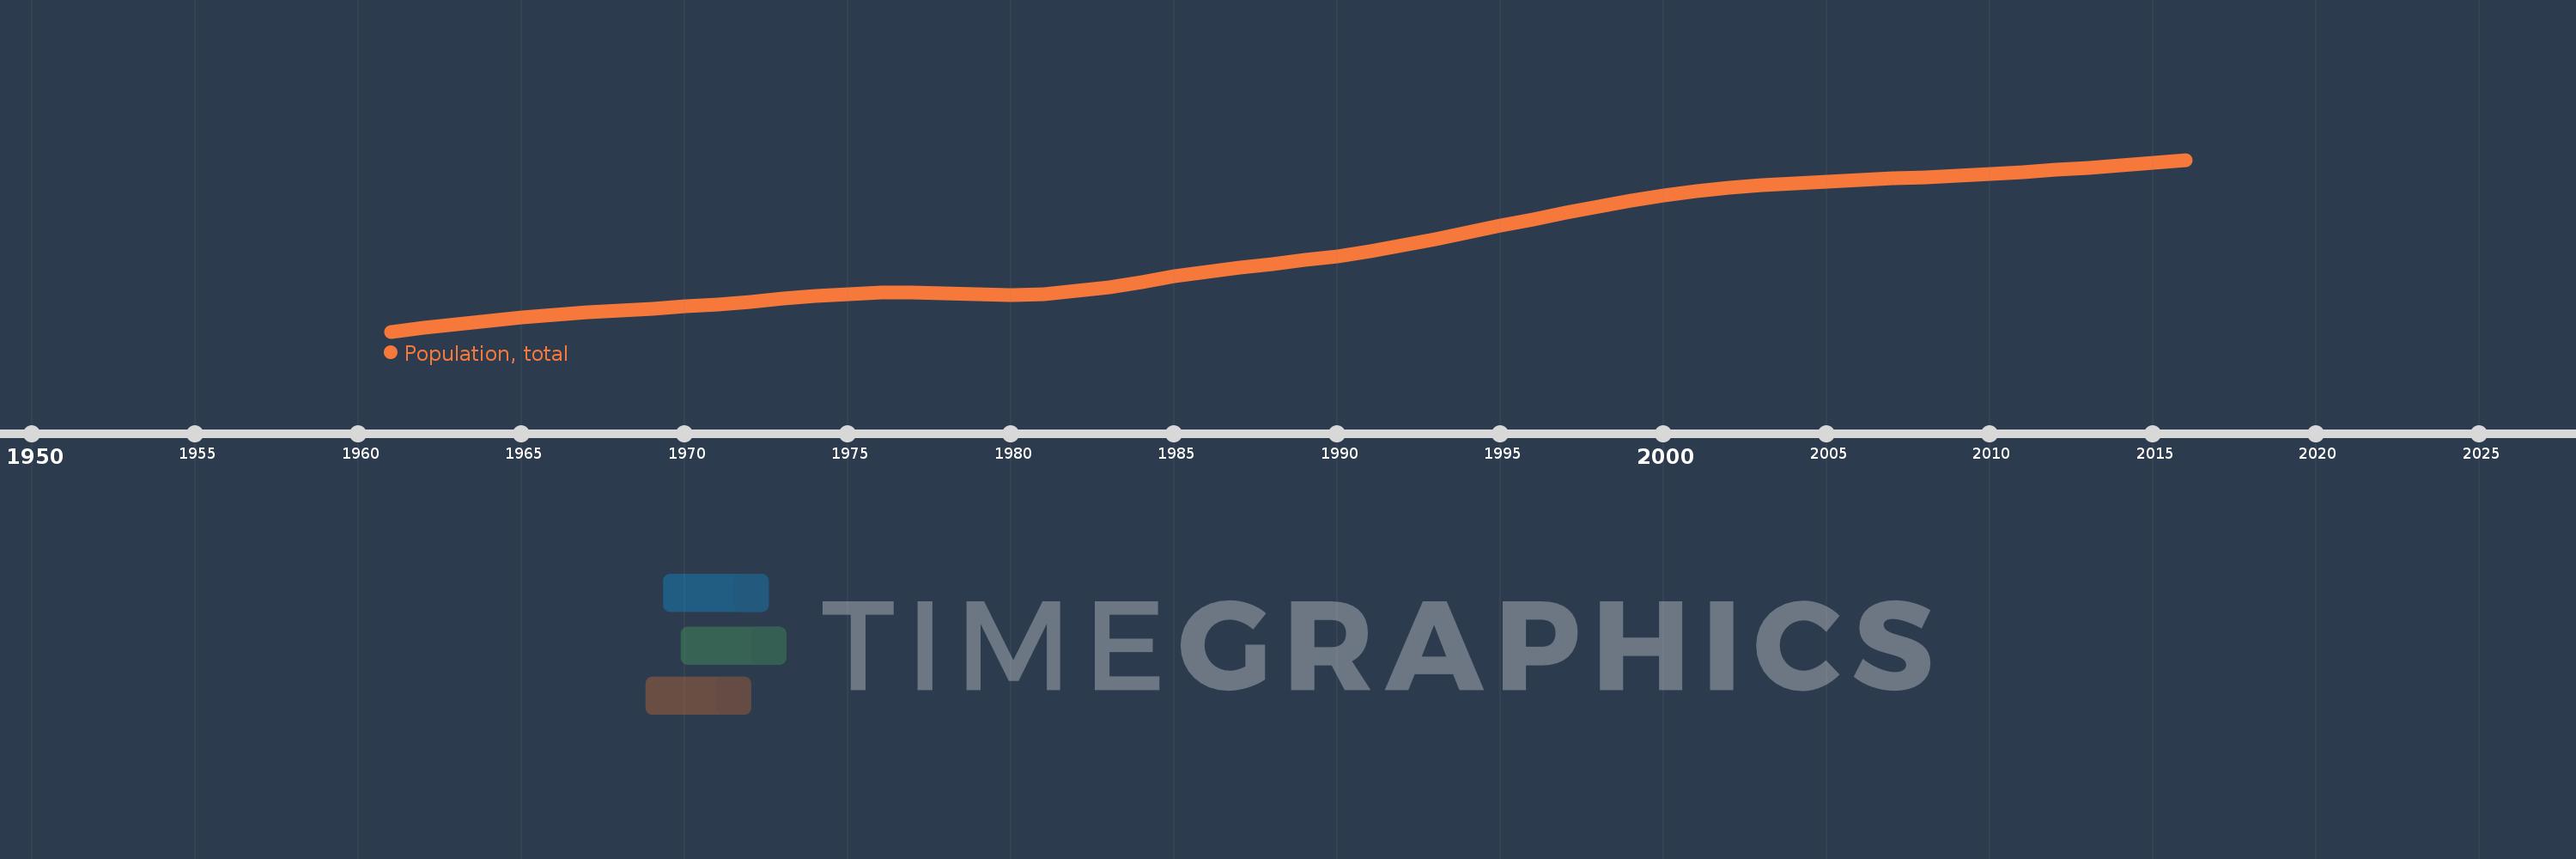
Population, total
2016,2015,2014,2013,2012,2011,2010,2009,2008,2007,2006,2005,2004,2003,2002,2001,2000,1999,1998,1997,1996,1995,1994,1993,1992,1991,1990,1989,1988,1987,1986,1985,1984,1983,1982,1981,1980,1979,1978,1977,1976,1975,1974,1973,1972,1971,1970,1969,1968,1967,1966,1965,1964,1963,1962,1961
Diese Statistik in anderen Ländern:
AfghanistanAlbaniaAlgeriaAmerican SamoaAndorraAngolaAntigua and BarbudaArab WorldArgentinaArmeniaArubaAustraliaAustriaAzerbaijanBahamas, TheBahrainBangladeshBarbadosBelarusBelgiumBelizeBeninBermudaBhutanBoliviaBosnia and HerzegovinaBotswanaBrazilBritish Virgin IslandsBrunei DarussalamBulgariaBurkina FasoBurundiCabo VerdeCambodiaCameroonCanadaCaribbean small statesCayman IslandsCentral African RepublicCentral Europe and the BalticsChadChannel IslandsChileChinaColombiaComorosCongo, Dem. Rep.Congo, Rep.Costa RicaCote d'IvoireCroatiaCubaCuracaoCyprusCzech RepublicDenmarkDjiboutiDominicaDominican RepublicEarly-demographic dividendEast Asia & PacificEast Asia & Pacific (excluding high income)East Asia & Pacific (IDA & IBRD countries)EcuadorEgypt, Arab Rep.El SalvadorEquatorial GuineaEritreaEstoniaEthiopiaEuro areaEurope & Central AsiaEurope & Central Asia (excluding high income)Europe & Central Asia (IDA & IBRD countries)European UnionFaroe IslandsFijiFinlandFragile and conflict affected situationsFranceFrench PolynesiaGabonGambia, TheGeorgiaGermanyGhanaGibraltarGreeceGreenlandGrenadaGuamGuatemalaGuineaGuinea-BissauGuyanaHaitiHeavily indebted poor countries (HIPC)High incomeHondurasHong Kong SAR, ChinaHungaryIBRD onlyIcelandIDA & IBRD totalIDA blendIDA onlyIDA totalIndiaIndonesiaIran, Islamic Rep.IraqIrelandIsle of ManIsraelItalyJamaicaJapanJordanKazakhstanKenyaKiribatiKorea, Dem. People’s Rep.Korea, Rep.KosovoKuwaitKyrgyz RepublicLao PDRLate-demographic dividendLatin America & Caribbean Latin America & Caribbean (excluding high income)Latin America & the Caribbean (IDA & IBRD countries)LatviaLeast developed countries: UN classificationLebanonLesothoLiberiaLibyaLiechtensteinLithuaniaLow & middle incomeLow incomeLower middle incomeLuxembourgMacao SAR, ChinaMacedonia, FYRMadagascarMalawiMalaysiaMaldivesMaliMaltaMarshall IslandsMauritaniaMauritiusMexicoMicronesia, Fed. Sts.Middle East & North AfricaMiddle East & North Africa (excluding high income)Middle East & North Africa (IDA & IBRD countries)Middle incomeMoldovaMonacoMongoliaMontenegroMoroccoMozambiqueMyanmarNamibiaNauruNepalNetherlandsNew CaledoniaNew ZealandNicaraguaNigerNigeriaNorth AmericaNorthern Mariana IslandsNorwayOECD membersOmanOther small statesPacific island small statesPakistanPalauPanamaPapua New GuineaParaguayPeruPhilippinesPolandPortugalPost-demographic dividendPre-demographic dividendPuerto RicoQatarRomaniaRussian FederationRwandaSamoaSan MarinoSao Tome and PrincipeSaudi ArabiaSenegalSerbiaSeychellesSierra LeoneSingaporeSint Maarten (Dutch part)Slovak RepublicSloveniaSmall statesSolomon IslandsSomaliaSouth AfricaSouth AsiaSouth Asia (IDA & IBRD)South SudanSpainSri LankaSt. Kitts and NevisSt. LuciaSt. Martin (French part)St. Vincent and the GrenadinesSub-Saharan Africa Sub-Saharan Africa (excluding high income)Sub-Saharan Africa (IDA & IBRD countries)SudanSurinameSwazilandSwedenSwitzerlandSyrian Arab RepublicTajikistanTanzaniaThailandTimor-LesteTogoTongaTrinidad and TobagoTunisiaTurkeyTurkmenistanTurks and Caicos IslandsTuvaluUgandaUkraineUnited Arab EmiratesUnited KingdomUnited StatesUpper middle incomeUruguayUzbekistanVanuatuVenezuela, RBVietnamVirgin Islands (U.S.)West Bank and GazaWorldYemen, Rep.ZambiaZimbabwe Zeitlinie:
Diese Zeitleiste vorliegt die Graphik ab 1961 J. bis 2016 J. Palau. Die Angaben bis 1960 J. sind nicht vorhanden. Die Zahl aktueller Beobachtungen nach Daten: 56.
Die Quelle (Bezeichnung):
Kennzahlen der Weltentwicklung
Die Quelle (Einrichtung):
(1) United Nations Population Division. World Population Prospects, (2) Census reports and other statistical publications from national statistical offices, (3) Eurostat: Demographic Statistics, (4) United Nations Statistical Division. Population and Vital Statistics Report (various years), (5) U.S. Census Bureau: International Database, and (6) Secretariat of the Pacific Community: Statistics and Demography Programme.
Kategorien:
Climate Change, Health
Es wurde aktualisiert:
23 Apr 2017 Jahr
Kennzahlen der Wertänderungen vom Jahr zum Jahr
im Durchschnitt:
15.261 Tsnd.
Minimum:
9.638 Tsnd.
1 Jan 1961 Jahr
Maximum:
21.291 Tsnd.
1 Jan 2016 Jahr
Zum Datum der Beobachtung
Wert
Absolute Veränderung
Die Veränderung bezüglich dem vorherigen Wert
1 Jan 1961 Jahr
9.638 Tsnd.
+9.638 Tsnd.
0.0%
1 Jan 1962 Jahr
9.901 Tsnd.
+263.0
2.73%
1 Jan 1963 Jahr
10.15 Tsnd.
+249.0
2.51%
1 Jan 1964 Jahr
10.381 Tsnd.
+231.0
2.28%
1 Jan 1965 Jahr
10.593 Tsnd.
+212.0
2.04%
1 Jan 1966 Jahr
10.782 Tsnd.
+189.0
1.78%
1 Jan 1967 Jahr
10.945 Tsnd.
+163.0
1.51%
1 Jan 1968 Jahr
11.081 Tsnd.
+136.0
1.24%
1 Jan 1969 Jahr
11.206 Tsnd.
+125.0
1.13%
1 Jan 1970 Jahr
11.335 Tsnd.
+129.0
1.15%
1 Jan 1971 Jahr
11.481 Tsnd.
+146.0
1.29%
1 Jan 1972 Jahr
11.656 Tsnd.
+175.0
1.52%
1 Jan 1973 Jahr
11.853 Tsnd.
+197.0
1.69%
1 Jan 1974 Jahr
12.045 Tsnd.
+192.0
1.62%
1 Jan 1975 Jahr
12.195 Tsnd.
+150.0
1.25%
1 Jan 1976 Jahr
12.28 Tsnd.
+85.0
0.7%
1 Jan 1977 Jahr
12.284 Tsnd.
+4.0
0.03%
1 Jan 1978 Jahr
12.225 Tsnd.
-59.0
-0.48%
1 Jan 1979 Jahr
12.151 Tsnd.
-74.0
-0.61%
1 Jan 1980 Jahr
12.127 Tsnd.
-24.0
-0.2%
1 Jan 1981 Jahr
12.197 Tsnd.
+70.0
0.58%
1 Jan 1982 Jahr
12.383 Tsnd.
+186.0
1.52%
1 Jan 1983 Jahr
12.667 Tsnd.
+284.0
2.29%
1 Jan 1984 Jahr
13.015 Tsnd.
+348.0
2.75%
1 Jan 1985 Jahr
13.371 Tsnd.
+356.0
2.74%
1 Jan 1986 Jahr
13.698 Tsnd.
+327.0
2.45%
1 Jan 1987 Jahr
13.982 Tsnd.
+284.0
2.07%
1 Jan 1988 Jahr
14.237 Tsnd.
+255.0
1.82%
1 Jan 1989 Jahr
14.485 Tsnd.
+248.0
1.74%
1 Jan 1990 Jahr
14.762 Tsnd.
+277.0
1.91%
1 Jan 1991 Jahr
15.089 Tsnd.
+327.0
2.22%
1 Jan 1992 Jahr
15.471 Tsnd.
+382.0
2.53%
1 Jan 1993 Jahr
15.894 Tsnd.
+423.0
2.73%
1 Jan 1994 Jahr
16.345 Tsnd.
+451.0
2.84%
1 Jan 1995 Jahr
16.805 Tsnd.
+460.0
2.81%
1 Jan 1996 Jahr
17.255 Tsnd.
+450.0
2.68%
1 Jan 1997 Jahr
17.695 Tsnd.
+440.0
2.55%
1 Jan 1998 Jahr
18.123 Tsnd.
+428.0
2.42%
1 Jan 1999 Jahr
18.524 Tsnd.
+401.0
2.21%
1 Jan 2000 Jahr
18.878 Tsnd.
+354.0
1.91%
1 Jan 2001 Jahr
19.174 Tsnd.
+296.0
1.57%
1 Jan 2002 Jahr
19.404 Tsnd.
+230.0
1.2%
1 Jan 2003 Jahr
19.575 Tsnd.
+171.0
0.88%
1 Jan 2004 Jahr
19.7 Tsnd.
+125.0
0.64%
1 Jan 2005 Jahr
19.805 Tsnd.
+105.0
0.53%
1 Jan 2006 Jahr
19.907 Tsnd.
+102.0
0.52%
1 Jan 2007 Jahr
20.012 Tsnd.
+105.0
0.53%
1 Jan 2008 Jahr
20.118 Tsnd.
+106.0
0.53%
1 Jan 2009 Jahr
20.227 Tsnd.
+109.0
0.54%
1 Jan 2010 Jahr
20.344 Tsnd.
+117.0
0.58%
1 Jan 2011 Jahr
20.47 Tsnd.
+126.0
0.62%
1 Jan 2012 Jahr
20.606 Tsnd.
+136.0
0.66%
1 Jan 2013 Jahr
20.756 Tsnd.
+150.0
0.73%
1 Jan 2014 Jahr
20.919 Tsnd.
+163.0
0.79%
1 Jan 2015 Jahr
21.097 Tsnd.
+178.0
0.85%
1 Jan 2016 Jahr
21.291 Tsnd.
+194.0
0.92%
Bewertung der Länder gemäß mit laufender Statistik nach Jahren


Kommentare: