29
/de/
de
AIzaSyAYiBZKx7MnpbEhh9jyipgxe19OcubqV5w
April 1, 2024
43154
Latin America & the Caribbean (IDA & IBRD countries)
TLA
false
2
1
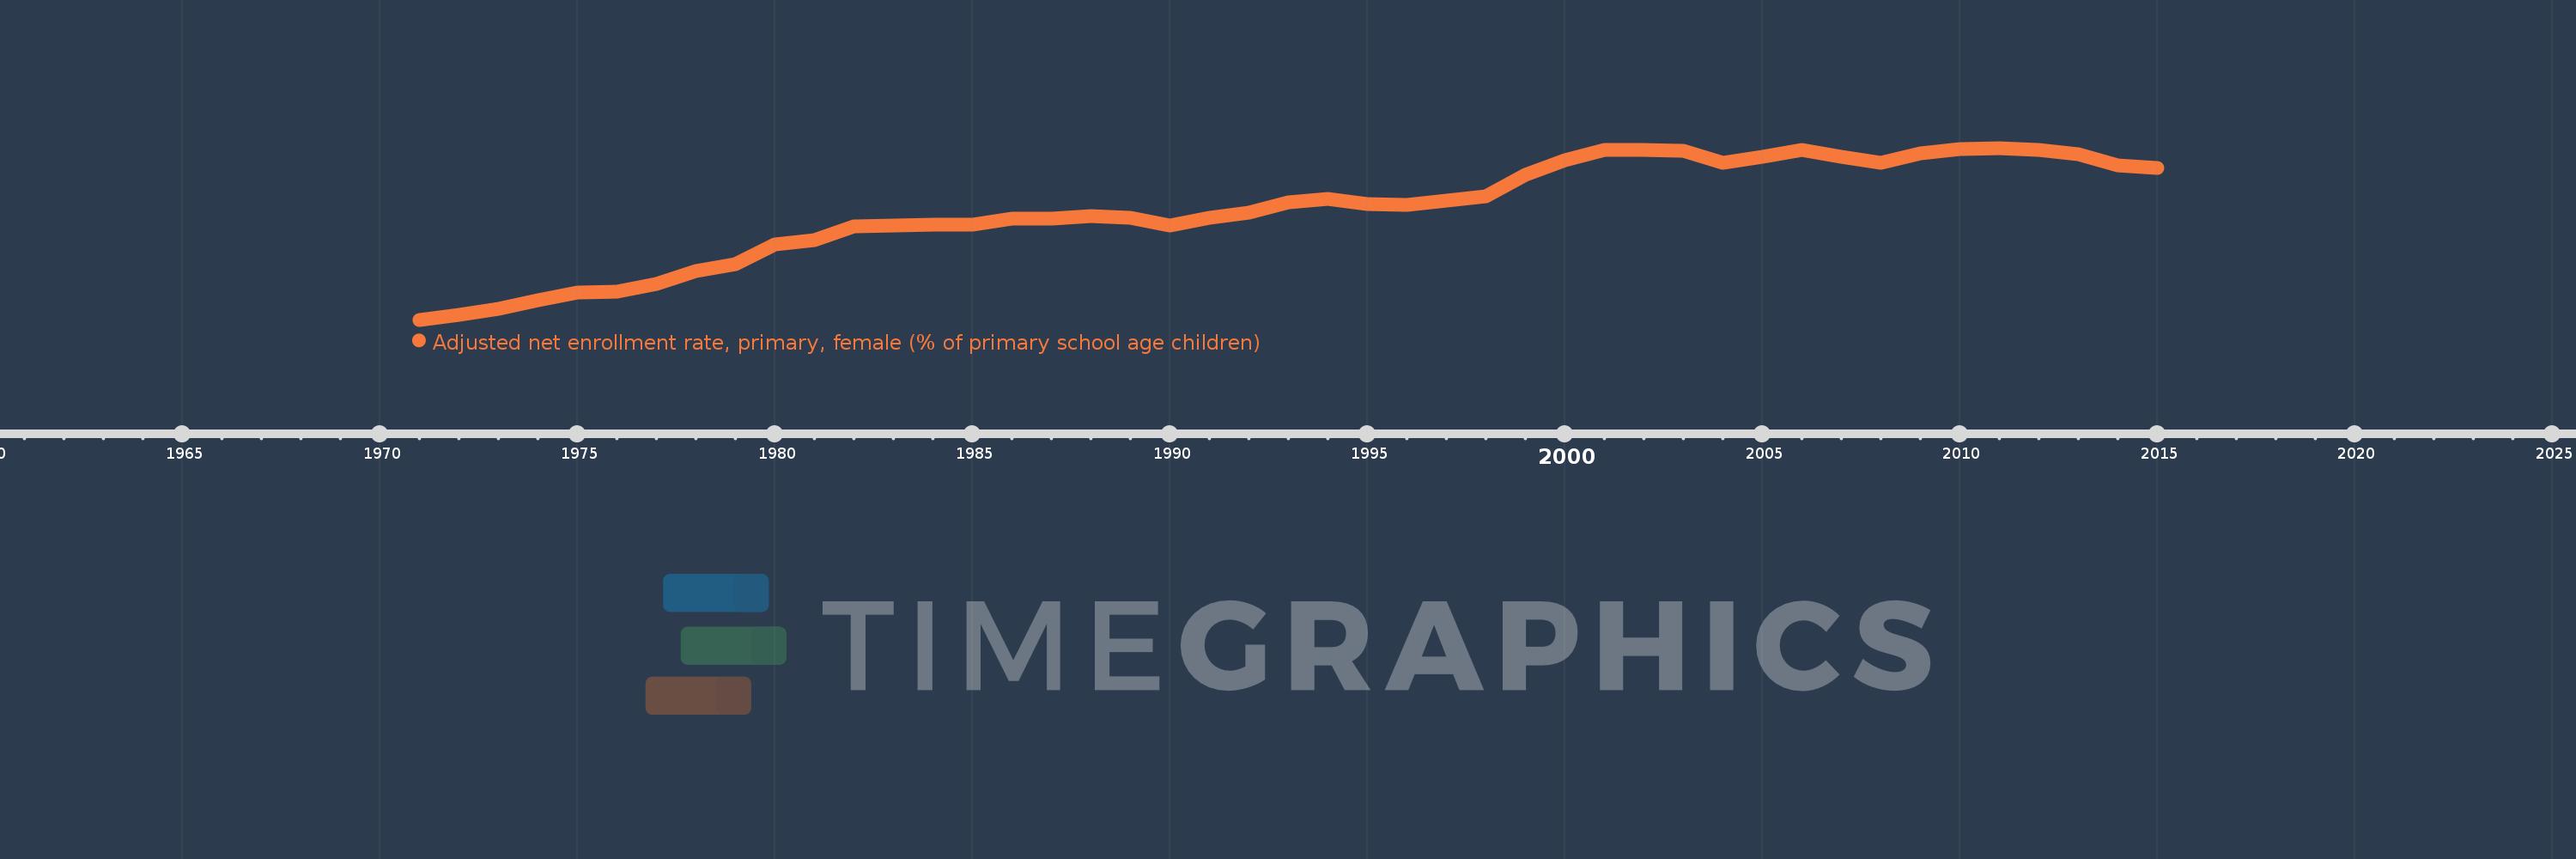
Adjusted net enrollment rate, primary, female (% of primary school age children)
2015,2014,2013,2012,2011,2010,2009,2008,2007,2006,2005,2004,2003,2002,2001,2000,1999,1998,1997,1996,1995,1994,1993,1992,1991,1990,1989,1988,1987,1986,1985,1984,1983,1982,1981,1980,1979,1978,1977,1976,1975,1974,1973,1972,1971
Diese Statistik in anderen Ländern:
AfghanistanAlbaniaAlgeriaAngolaAntigua and BarbudaArab WorldArgentinaArmeniaArubaAustraliaAustriaAzerbaijanBahamas, TheBahrainBangladeshBarbadosBelarusBelgiumBelizeBeninBermudaBhutanBoliviaBosnia and HerzegovinaBotswanaBrazilBrunei DarussalamBulgariaBurkina FasoBurundiCabo VerdeCambodiaCameroonCanadaCaribbean small statesCentral African RepublicCentral Europe and the BalticsChadChileChinaColombiaComorosCongo, Dem. Rep.Congo, Rep.Costa RicaCote d'IvoireCroatiaCubaCyprusDenmarkDjiboutiDominicaDominican RepublicEarly-demographic dividendEast Asia & PacificEast Asia & Pacific (excluding high income)East Asia & Pacific (IDA & IBRD countries)EcuadorEgypt, Arab Rep.El SalvadorEquatorial GuineaEritreaEstoniaEthiopiaEuro areaEurope & Central AsiaEurope & Central Asia (excluding high income)Europe & Central Asia (IDA & IBRD countries)European UnionFijiFinlandFragile and conflict affected situationsFranceGabonGambia, TheGeorgiaGhanaGreeceGrenadaGuatemalaGuineaGuinea-BissauGuyanaHaitiHeavily indebted poor countries (HIPC)High incomeHondurasHong Kong SAR, ChinaHungaryIBRD onlyIcelandIDA & IBRD totalIDA blendIDA onlyIDA totalIndiaIndonesiaIran, Islamic Rep.IraqIrelandIsraelItalyJamaicaJapanJordanKazakhstanKenyaKiribatiKorea, Dem. People’s Rep.Korea, Rep.KuwaitKyrgyz RepublicLao PDRLate-demographic dividendLatin America & Caribbean Latin America & Caribbean (excluding high income)Latin America & the Caribbean (IDA & IBRD countries)LatviaLeast developed countries: UN classificationLebanonLesothoLiberiaLibyaLiechtensteinLithuaniaLow & middle incomeLow incomeLower middle incomeLuxembourgMacao SAR, ChinaMacedonia, FYRMadagascarMalawiMaldivesMaliMaltaMarshall IslandsMauritaniaMauritiusMexicoMicronesia, Fed. Sts.Middle East & North AfricaMiddle East & North Africa (excluding high income)Middle East & North Africa (IDA & IBRD countries)Middle incomeMoldovaMongoliaMontenegroMoroccoMozambiqueMyanmarNamibiaNauruNepalNetherlandsNew ZealandNicaraguaNigerNigeriaNorth AmericaNorwayOECD membersOmanOther small statesPacific island small statesPakistanPanamaPapua New GuineaParaguayPeruPhilippinesPolandPortugalPost-demographic dividendPre-demographic dividendPuerto RicoQatarRomaniaRussian FederationRwandaSamoaSan MarinoSao Tome and PrincipeSaudi ArabiaSenegalSerbiaSeychellesSierra LeoneSloveniaSmall statesSolomon IslandsSomaliaSouth AfricaSouth AsiaSouth Asia (IDA & IBRD)South SudanSpainSri LankaSt. Kitts and NevisSt. LuciaSt. Vincent and the GrenadinesSub-Saharan Africa Sub-Saharan Africa (excluding high income)Sub-Saharan Africa (IDA & IBRD countries)SudanSurinameSwazilandSwedenSwitzerlandSyrian Arab RepublicTajikistanTanzaniaThailandTimor-LesteTogoTongaTrinidad and TobagoTunisiaTurkeyTuvaluUgandaUkraineUnited Arab EmiratesUnited KingdomUnited StatesUpper middle incomeUruguayUzbekistanVanuatuVenezuela, RBWest Bank and GazaWorldYemen, Rep.ZambiaZimbabwe Zeitlinie:
Diese Zeitleiste vorliegt die Graphik ab 1971 J. bis 2015 J. Latin America & the Caribbean (IDA & IBRD countries). Die Angaben bis 1970 J. sind nicht vorhanden. Die Zahl aktueller Beobachtungen nach Daten: 45.
Die Quelle (Bezeichnung):
Kennzahlen der Weltentwicklung
Die Quelle (Einrichtung):
United Nations Educational, Scientific, and Cultural Organization (UNESCO) Institute for Statistics.
Kategorien:
Education, Gender
Es wurde aktualisiert:
23 Apr 2017 Jahr
Kennzahlen der Wertänderungen vom Jahr zum Jahr
Minimum:
82.273
1 Jan 1971 Jahr
Maximum:
95.787
1 Jan 2011 Jahr
Zum Datum der Beobachtung
Wert
Absolute Veränderung
Die Veränderung bezüglich dem vorherigen Wert
1 Jan 1971 Jahr
82.273
+82.273
0.0%
1 Jan 1972 Jahr
82.651
+0.378
0.46%
1 Jan 1973 Jahr
83.153
+0.502
0.61%
1 Jan 1974 Jahr
83.816
+0.664
0.8%
1 Jan 1975 Jahr
84.397
+0.58
0.69%
1 Jan 1976 Jahr
84.484
+0.087
0.1%
1 Jan 1977 Jahr
85.111
+0.627
0.74%
1 Jan 1978 Jahr
86.111
+1.001
1.18%
1 Jan 1979 Jahr
86.668
+0.556
0.65%
1 Jan 1980 Jahr
88.226
+1.559
1.8%
1 Jan 1981 Jahr
88.53
+0.303
0.34%
1 Jan 1982 Jahr
89.62
+1.09
1.23%
1 Jan 1983 Jahr
89.673
+0.053
0.06%
1 Jan 1984 Jahr
89.743
+0.07
0.08%
1 Jan 1985 Jahr
89.754
+0.011
0.01%
1 Jan 1986 Jahr
90.198
+0.444
0.49%
1 Jan 1987 Jahr
90.207
+0.009
0.01%
1 Jan 1988 Jahr
90.441
+0.234
0.26%
1 Jan 1989 Jahr
90.312
-0.129
-0.14%
1 Jan 1990 Jahr
89.714
-0.598
-0.66%
1 Jan 1991 Jahr
90.327
+0.613
0.68%
1 Jan 1992 Jahr
90.724
+0.397
0.44%
1 Jan 1993 Jahr
91.517
+0.794
0.87%
1 Jan 1994 Jahr
91.794
+0.277
0.3%
1 Jan 1995 Jahr
91.342
-0.453
-0.49%
1 Jan 1996 Jahr
91.334
-0.008
-0.01%
1 Jan 1997 Jahr
91.64
+0.306
0.33%
1 Jan 1998 Jahr
91.957
+0.318
0.35%
1 Jan 1999 Jahr
93.645
+1.688
1.84%
1 Jan 2000 Jahr
94.817
+1.172
1.25%
1 Jan 2001 Jahr
95.617
+0.8
0.84%
1 Jan 2002 Jahr
95.651
+0.034
0.04%
1 Jan 2003 Jahr
95.594
-0.057
-0.06%
1 Jan 2004 Jahr
94.604
-0.99
-1.04%
1 Jan 2005 Jahr
95.106
+0.502
0.53%
1 Jan 2006 Jahr
95.628
+0.522
0.55%
1 Jan 2007 Jahr
95.076
-0.552
-0.58%
1 Jan 2008 Jahr
94.591
-0.486
-0.51%
1 Jan 2009 Jahr
95.371
+0.781
0.83%
1 Jan 2010 Jahr
95.715
+0.343
0.36%
1 Jan 2011 Jahr
95.787
+0.073
0.08%
1 Jan 2012 Jahr
95.632
-0.155
-0.16%
1 Jan 2013 Jahr
95.316
-0.316
-0.33%
1 Jan 2014 Jahr
94.406
-0.91
-0.95%
1 Jan 2015 Jahr
94.236
-0.17
-0.18%
Bewertung der Länder gemäß mit laufender Statistik nach Jahren


Kommentare: