29
/de/
de
AIzaSyAYiBZKx7MnpbEhh9jyipgxe19OcubqV5w
April 1, 2024
141481
Greece
GRC
true
2
1
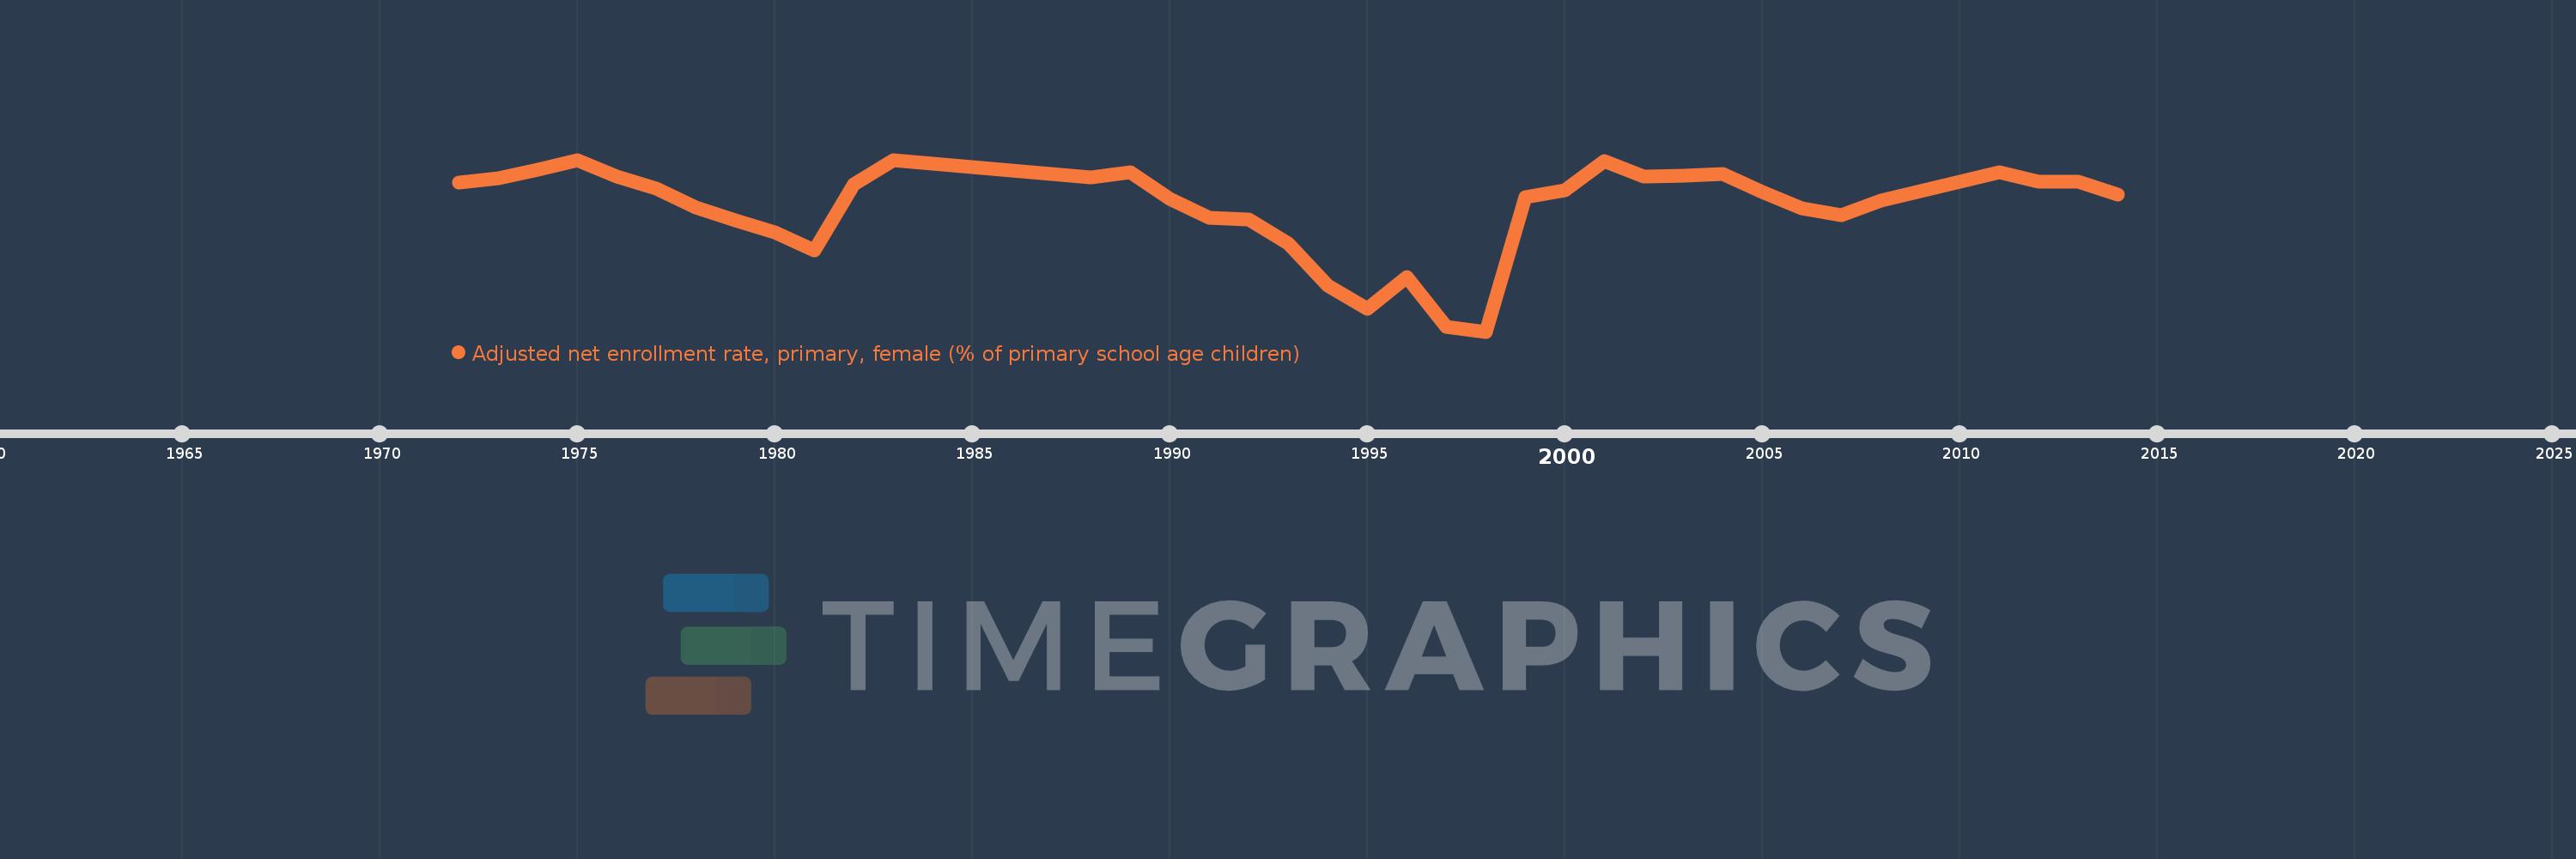
Adjusted net enrollment rate, primary, female (% of primary school age children)
2014,2013,2012,2011,2008,2007,2006,2005,2004,2003,2002,2001,2000,1999,1998,1997,1996,1995,1994,1993,1992,1991,1990,1989,1988,1983,1982,1981,1980,1979,1978,1977,1976,1975,1974,1973,1972
Diese Statistik in anderen Ländern:
AfghanistanAlbaniaAlgeriaAngolaAntigua and BarbudaArab WorldArgentinaArmeniaArubaAustraliaAustriaAzerbaijanBahamas, TheBahrainBangladeshBarbadosBelarusBelgiumBelizeBeninBermudaBhutanBoliviaBosnia and HerzegovinaBotswanaBrazilBrunei DarussalamBulgariaBurkina FasoBurundiCabo VerdeCambodiaCameroonCanadaCaribbean small statesCentral African RepublicCentral Europe and the BalticsChadChileChinaColombiaComorosCongo, Dem. Rep.Congo, Rep.Costa RicaCote d'IvoireCroatiaCubaCyprusDenmarkDjiboutiDominicaDominican RepublicEarly-demographic dividendEast Asia & PacificEast Asia & Pacific (excluding high income)East Asia & Pacific (IDA & IBRD countries)EcuadorEgypt, Arab Rep.El SalvadorEquatorial GuineaEritreaEstoniaEthiopiaEuro areaEurope & Central AsiaEurope & Central Asia (excluding high income)Europe & Central Asia (IDA & IBRD countries)European UnionFijiFinlandFragile and conflict affected situationsFranceGabonGambia, TheGeorgiaGhanaGreeceGrenadaGuatemalaGuineaGuinea-BissauGuyanaHaitiHeavily indebted poor countries (HIPC)High incomeHondurasHong Kong SAR, ChinaHungaryIBRD onlyIcelandIDA & IBRD totalIDA blendIDA onlyIDA totalIndiaIndonesiaIran, Islamic Rep.IraqIrelandIsraelItalyJamaicaJapanJordanKazakhstanKenyaKiribatiKorea, Dem. People’s Rep.Korea, Rep.KuwaitKyrgyz RepublicLao PDRLate-demographic dividendLatin America & Caribbean Latin America & Caribbean (excluding high income)Latin America & the Caribbean (IDA & IBRD countries)LatviaLeast developed countries: UN classificationLebanonLesothoLiberiaLibyaLiechtensteinLithuaniaLow & middle incomeLow incomeLower middle incomeLuxembourgMacao SAR, ChinaMacedonia, FYRMadagascarMalawiMaldivesMaliMaltaMarshall IslandsMauritaniaMauritiusMexicoMicronesia, Fed. Sts.Middle East & North AfricaMiddle East & North Africa (excluding high income)Middle East & North Africa (IDA & IBRD countries)Middle incomeMoldovaMongoliaMontenegroMoroccoMozambiqueMyanmarNamibiaNauruNepalNetherlandsNew ZealandNicaraguaNigerNigeriaNorth AmericaNorwayOECD membersOmanOther small statesPacific island small statesPakistanPanamaPapua New GuineaParaguayPeruPhilippinesPolandPortugalPost-demographic dividendPre-demographic dividendPuerto RicoQatarRomaniaRussian FederationRwandaSamoaSan MarinoSao Tome and PrincipeSaudi ArabiaSenegalSerbiaSeychellesSierra LeoneSloveniaSmall statesSolomon IslandsSomaliaSouth AfricaSouth AsiaSouth Asia (IDA & IBRD)South SudanSpainSri LankaSt. Kitts and NevisSt. LuciaSt. Vincent and the GrenadinesSub-Saharan Africa Sub-Saharan Africa (excluding high income)Sub-Saharan Africa (IDA & IBRD countries)SudanSurinameSwazilandSwedenSwitzerlandSyrian Arab RepublicTajikistanTanzaniaThailandTimor-LesteTogoTongaTrinidad and TobagoTunisiaTurkeyTuvaluUgandaUkraineUnited Arab EmiratesUnited KingdomUnited StatesUpper middle incomeUruguayUzbekistanVanuatuVenezuela, RBWest Bank and GazaWorldYemen, Rep.ZambiaZimbabwe Zeitlinie:
Diese Zeitleiste vorliegt die Graphik ab 1972 J. bis 2014 J. Greece. Die Angaben bis 1971 J. sind nicht vorhanden. Die Zahl aktueller Beobachtungen nach Daten: 37.
Die Quelle (Bezeichnung):
Kennzahlen der Weltentwicklung
Die Quelle (Einrichtung):
United Nations Educational, Scientific, and Cultural Organization (UNESCO) Institute for Statistics.
Kategorien:
Education, Gender
Es wurde aktualisiert:
23 Apr 2017 Jahr
Kennzahlen der Wertänderungen vom Jahr zum Jahr
Minimum:
90.078
1 Jan 1998 Jahr
Maximum:
98.389
1 Jan 1975 Jahr
Zum Datum der Beobachtung
Wert
Absolute Veränderung
Die Veränderung bezüglich dem vorherigen Wert
1 Jan 1972 Jahr
97.269
+97.269
0.0%
1 Jan 1973 Jahr
97.51
+0.241
0.25%
1 Jan 1974 Jahr
97.909
+0.399
0.41%
1 Jan 1975 Jahr
98.389
+0.481
0.49%
1 Jan 1976 Jahr
97.58
-0.809
-0.82%
1 Jan 1977 Jahr
97.01
-0.57
-0.58%
1 Jan 1978 Jahr
96.084
-0.926
-0.95%
1 Jan 1979 Jahr
95.442
-0.642
-0.67%
1 Jan 1980 Jahr
94.879
-0.563
-0.59%
1 Jan 1981 Jahr
93.99
-0.89
-0.94%
1 Jan 1982 Jahr
97.208
+3.218
3.42%
1 Jan 1983 Jahr
98.361
+1.154
1.19%
1 Jan 1988 Jahr
97.523
-0.839
-0.85%
1 Jan 1989 Jahr
97.77
+0.247
0.25%
1 Jan 1990 Jahr
96.496
-1.274
-1.3%
1 Jan 1991 Jahr
95.579
-0.917
-0.95%
1 Jan 1992 Jahr
95.514
-0.065
-0.07%
1 Jan 1993 Jahr
94.345
-1.169
-1.22%
1 Jan 1994 Jahr
92.286
-2.059
-2.18%
1 Jan 1995 Jahr
91.188
-1.099
-1.19%
1 Jan 1996 Jahr
92.72
+1.532
1.68%
1 Jan 1997 Jahr
90.327
-2.393
-2.58%
1 Jan 1998 Jahr
90.078
-0.249
-0.28%
1 Jan 1999 Jahr
96.563
+6.485
7.2%
1 Jan 2000 Jahr
96.925
+0.362
0.37%
1 Jan 2001 Jahr
98.325
+1.4
1.44%
1 Jan 2002 Jahr
97.574
-0.751
-0.76%
1 Jan 2003 Jahr
97.605
+0.032
0.03%
1 Jan 2004 Jahr
97.686
+0.081
0.08%
1 Jan 2005 Jahr
96.829
-0.858
-0.88%
1 Jan 2006 Jahr
96.05
-0.779
-0.8%
1 Jan 2007 Jahr
95.703
-0.347
-0.36%
1 Jan 2008 Jahr
96.432
+0.729
0.76%
1 Jan 2011 Jahr
97.792
+1.36
1.41%
1 Jan 2012 Jahr
97.346
-0.446
-0.46%
1 Jan 2013 Jahr
97.322
-0.025
-0.03%
1 Jan 2014 Jahr
96.719
-0.603
-0.62%
Bewertung der Länder gemäß mit laufender Statistik nach Jahren


Kommentare: