29
/de/
de
AIzaSyAYiBZKx7MnpbEhh9jyipgxe19OcubqV5w
April 1, 2024
33998
Fragile and conflict affected situations
FCS
false
2
1
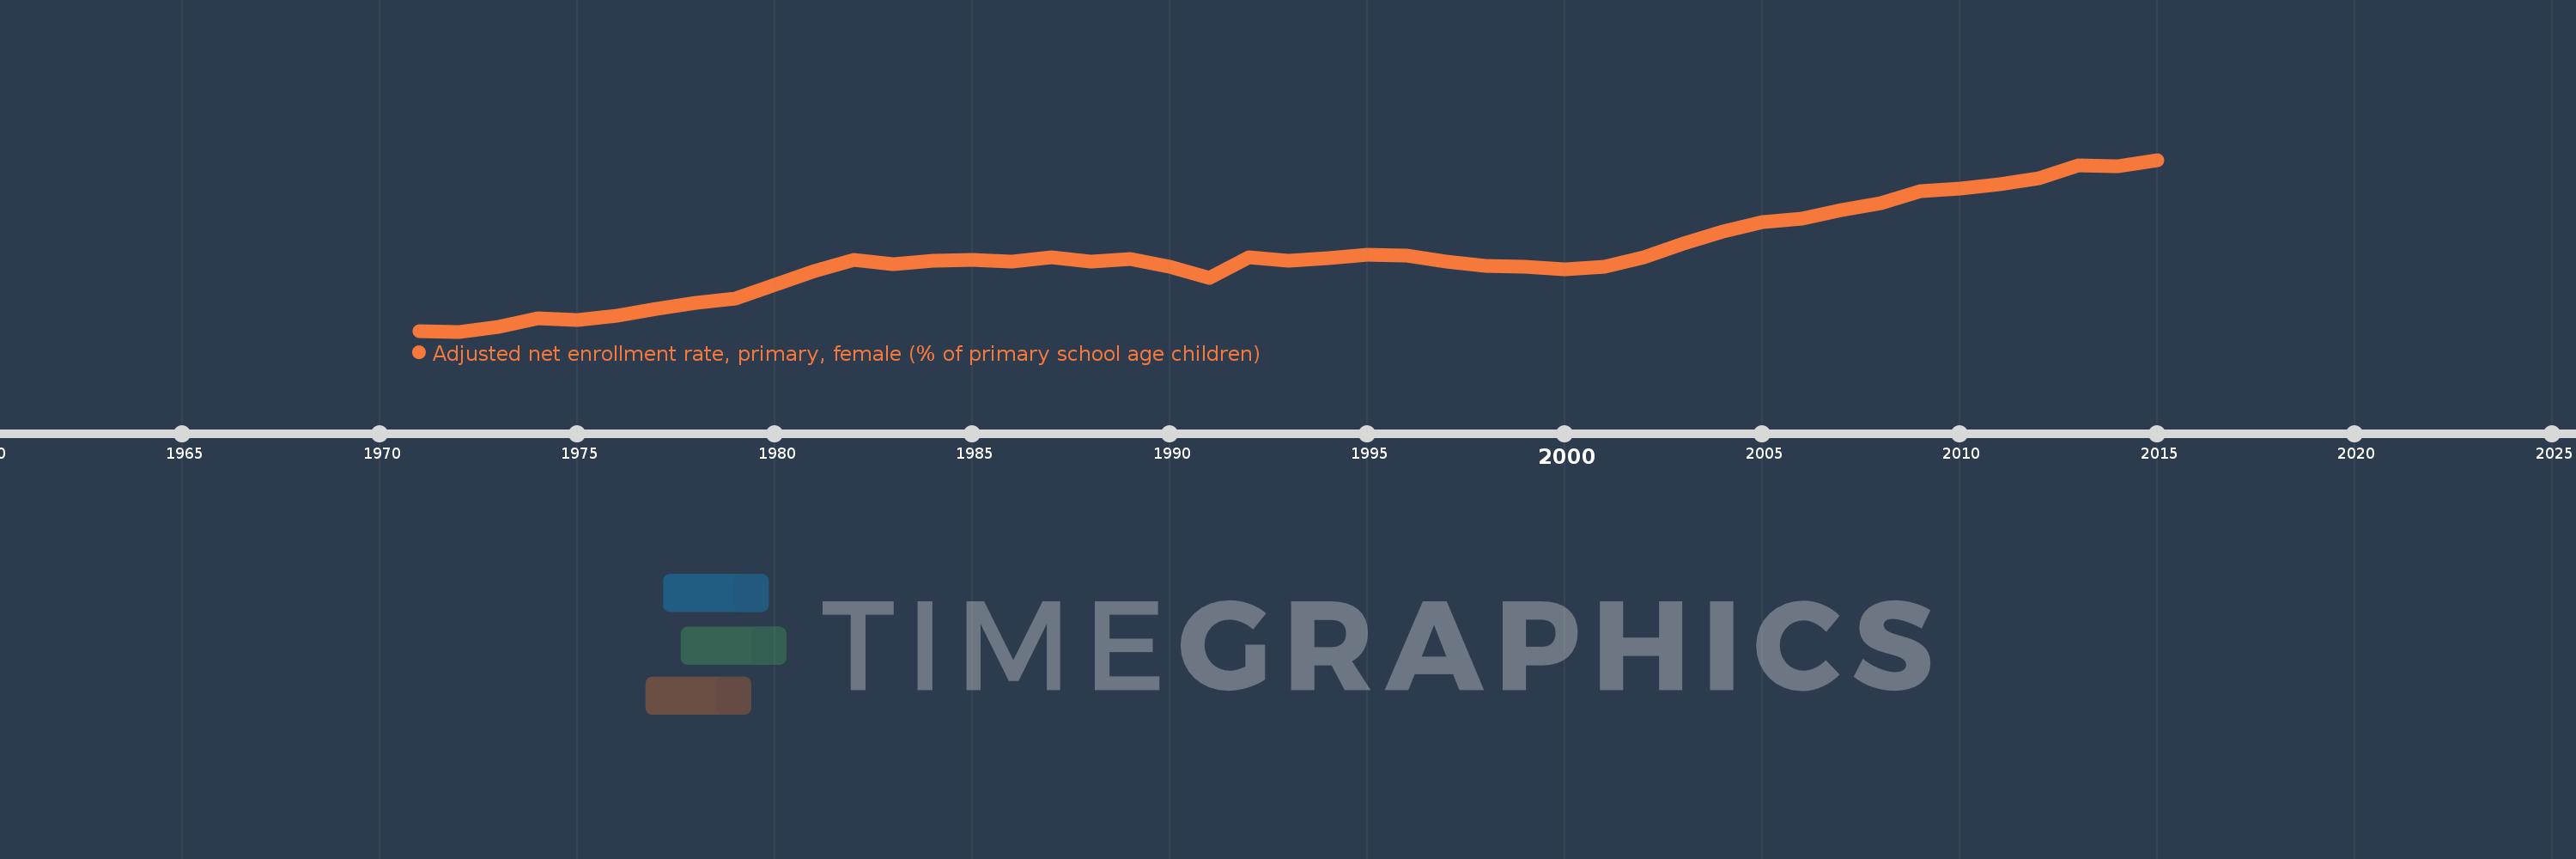
Adjusted net enrollment rate, primary, female (% of primary school age children)
2015,2014,2013,2012,2011,2010,2009,2008,2007,2006,2005,2004,2003,2002,2001,2000,1999,1998,1997,1996,1995,1994,1993,1992,1991,1990,1989,1988,1987,1986,1985,1984,1983,1982,1981,1980,1979,1978,1977,1976,1975,1974,1973,1972,1971
Diese Statistik in anderen Ländern:
AfghanistanAlbaniaAlgeriaAngolaAntigua and BarbudaArab WorldArgentinaArmeniaArubaAustraliaAustriaAzerbaijanBahamas, TheBahrainBangladeshBarbadosBelarusBelgiumBelizeBeninBermudaBhutanBoliviaBosnia and HerzegovinaBotswanaBrazilBrunei DarussalamBulgariaBurkina FasoBurundiCabo VerdeCambodiaCameroonCanadaCaribbean small statesCentral African RepublicCentral Europe and the BalticsChadChileChinaColombiaComorosCongo, Dem. Rep.Congo, Rep.Costa RicaCote d'IvoireCroatiaCubaCyprusDenmarkDjiboutiDominicaDominican RepublicEarly-demographic dividendEast Asia & PacificEast Asia & Pacific (excluding high income)East Asia & Pacific (IDA & IBRD countries)EcuadorEgypt, Arab Rep.El SalvadorEquatorial GuineaEritreaEstoniaEthiopiaEuro areaEurope & Central AsiaEurope & Central Asia (excluding high income)Europe & Central Asia (IDA & IBRD countries)European UnionFijiFinlandFragile and conflict affected situationsFranceGabonGambia, TheGeorgiaGhanaGreeceGrenadaGuatemalaGuineaGuinea-BissauGuyanaHaitiHeavily indebted poor countries (HIPC)High incomeHondurasHong Kong SAR, ChinaHungaryIBRD onlyIcelandIDA & IBRD totalIDA blendIDA onlyIDA totalIndiaIndonesiaIran, Islamic Rep.IraqIrelandIsraelItalyJamaicaJapanJordanKazakhstanKenyaKiribatiKorea, Dem. People’s Rep.Korea, Rep.KuwaitKyrgyz RepublicLao PDRLate-demographic dividendLatin America & Caribbean Latin America & Caribbean (excluding high income)Latin America & the Caribbean (IDA & IBRD countries)LatviaLeast developed countries: UN classificationLebanonLesothoLiberiaLibyaLiechtensteinLithuaniaLow & middle incomeLow incomeLower middle incomeLuxembourgMacao SAR, ChinaMacedonia, FYRMadagascarMalawiMaldivesMaliMaltaMarshall IslandsMauritaniaMauritiusMexicoMicronesia, Fed. Sts.Middle East & North AfricaMiddle East & North Africa (excluding high income)Middle East & North Africa (IDA & IBRD countries)Middle incomeMoldovaMongoliaMontenegroMoroccoMozambiqueMyanmarNamibiaNauruNepalNetherlandsNew ZealandNicaraguaNigerNigeriaNorth AmericaNorwayOECD membersOmanOther small statesPacific island small statesPakistanPanamaPapua New GuineaParaguayPeruPhilippinesPolandPortugalPost-demographic dividendPre-demographic dividendPuerto RicoQatarRomaniaRussian FederationRwandaSamoaSan MarinoSao Tome and PrincipeSaudi ArabiaSenegalSerbiaSeychellesSierra LeoneSloveniaSmall statesSolomon IslandsSomaliaSouth AfricaSouth AsiaSouth Asia (IDA & IBRD)South SudanSpainSri LankaSt. Kitts and NevisSt. LuciaSt. Vincent and the GrenadinesSub-Saharan Africa Sub-Saharan Africa (excluding high income)Sub-Saharan Africa (IDA & IBRD countries)SudanSurinameSwazilandSwedenSwitzerlandSyrian Arab RepublicTajikistanTanzaniaThailandTimor-LesteTogoTongaTrinidad and TobagoTunisiaTurkeyTuvaluUgandaUkraineUnited Arab EmiratesUnited KingdomUnited StatesUpper middle incomeUruguayUzbekistanVanuatuVenezuela, RBWest Bank and GazaWorldYemen, Rep.ZambiaZimbabwe Zeitlinie:
Diese Zeitleiste vorliegt die Graphik ab 1971 J. bis 2015 J. Fragile and conflict affected situations. Die Angaben bis 1970 J. sind nicht vorhanden. Die Zahl aktueller Beobachtungen nach Daten: 45.
Die Quelle (Bezeichnung):
Kennzahlen der Weltentwicklung
Die Quelle (Einrichtung):
United Nations Educational, Scientific, and Cultural Organization (UNESCO) Institute for Statistics.
Kategorien:
Education, Gender
Es wurde aktualisiert:
23 Apr 2017 Jahr
Kennzahlen der Wertänderungen vom Jahr zum Jahr
Minimum:
40.509
1 Jan 1972 Jahr
Maximum:
73.001
1 Jan 2015 Jahr
Zum Datum der Beobachtung
Wert
Absolute Veränderung
Die Veränderung bezüglich dem vorherigen Wert
1 Jan 1971 Jahr
40.583
+40.583
0.0%
1 Jan 1972 Jahr
40.509
-0.074
-0.18%
1 Jan 1973 Jahr
41.426
+0.917
2.26%
1 Jan 1974 Jahr
42.992
+1.566
3.78%
1 Jan 1975 Jahr
42.727
-0.265
-0.62%
1 Jan 1976 Jahr
43.574
+0.847
1.98%
1 Jan 1977 Jahr
44.845
+1.272
2.92%
1 Jan 1978 Jahr
46.022
+1.176
2.62%
1 Jan 1979 Jahr
46.791
+0.77
1.67%
1 Jan 1980 Jahr
49.298
+2.506
5.36%
1 Jan 1981 Jahr
51.942
+2.644
5.36%
1 Jan 1982 Jahr
54.081
+2.139
4.12%
1 Jan 1983 Jahr
53.274
-0.807
-1.49%
1 Jan 1984 Jahr
53.862
+0.588
1.1%
1 Jan 1985 Jahr
54.144
+0.282
0.52%
1 Jan 1986 Jahr
53.723
-0.421
-0.78%
1 Jan 1987 Jahr
54.515
+0.792
1.48%
1 Jan 1988 Jahr
53.733
-0.782
-1.44%
1 Jan 1989 Jahr
54.217
+0.484
0.9%
1 Jan 1990 Jahr
52.841
-1.377
-2.54%
1 Jan 1991 Jahr
50.706
-2.134
-4.04%
1 Jan 1992 Jahr
54.495
+3.789
7.47%
1 Jan 1993 Jahr
53.964
-0.531
-0.98%
1 Jan 1994 Jahr
54.324
+0.36
0.67%
1 Jan 1995 Jahr
55.006
+0.682
1.26%
1 Jan 1996 Jahr
54.962
-0.044
-0.08%
1 Jan 1997 Jahr
53.682
-1.28
-2.33%
1 Jan 1998 Jahr
52.875
-0.807
-1.5%
1 Jan 1999 Jahr
52.798
-0.076
-0.14%
1 Jan 2000 Jahr
52.221
-0.577
-1.09%
1 Jan 2001 Jahr
52.773
+0.552
1.06%
1 Jan 2002 Jahr
54.511
+1.737
3.29%
1 Jan 2003 Jahr
57.196
+2.685
4.93%
1 Jan 2004 Jahr
59.407
+2.212
3.87%
1 Jan 2005 Jahr
61.179
+1.772
2.98%
1 Jan 2006 Jahr
61.871
+0.692
1.13%
1 Jan 2007 Jahr
63.485
+1.614
2.61%
1 Jan 2008 Jahr
64.812
+1.328
2.09%
1 Jan 2009 Jahr
67.148
+2.336
3.6%
1 Jan 2010 Jahr
67.574
+0.425
0.63%
1 Jan 2011 Jahr
68.429
+0.855
1.27%
1 Jan 2012 Jahr
69.522
+1.093
1.6%
1 Jan 2013 Jahr
71.946
+2.424
3.49%
1 Jan 2014 Jahr
71.822
-0.124
-0.17%
1 Jan 2015 Jahr
73.001
+1.179
1.64%
Bewertung der Länder gemäß mit laufender Statistik nach Jahren


Kommentare: