29
/de/
de
AIzaSyAYiBZKx7MnpbEhh9jyipgxe19OcubqV5w
April 1, 2024
34344
Fragile and conflict affected situations
FCS
false
2
1
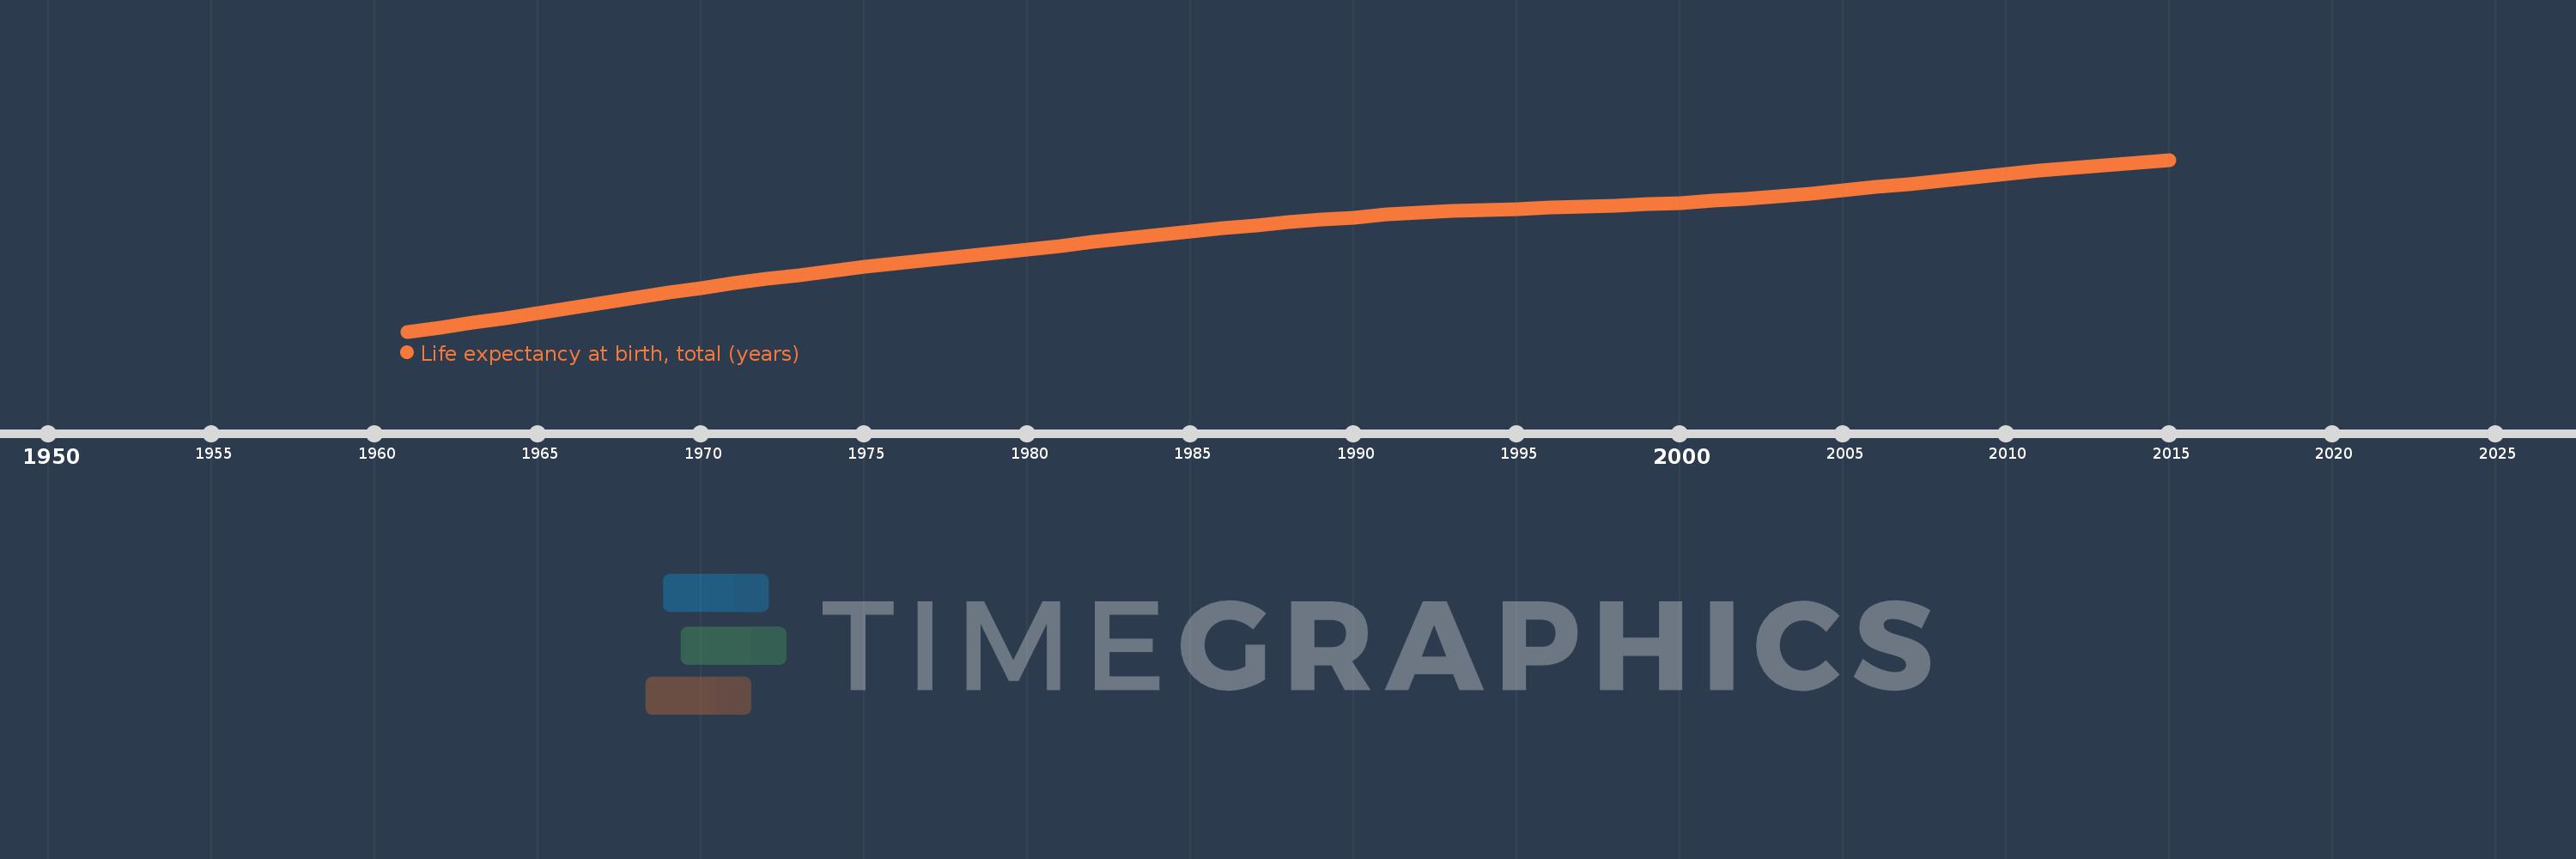
Life expectancy at birth, total (years)
2015,2014,2013,2012,2011,2010,2009,2008,2007,2006,2005,2004,2003,2002,2001,2000,1999,1998,1997,1996,1995,1994,1993,1992,1991,1990,1989,1988,1987,1986,1985,1984,1983,1982,1981,1980,1979,1978,1977,1976,1975,1974,1973,1972,1971,1970,1969,1968,1967,1966,1965,1964,1963,1962,1961
Diese Statistik in anderen Ländern:
AfghanistanAlbaniaAlgeriaAngolaAntigua and BarbudaArab WorldArgentinaArmeniaArubaAustraliaAustriaAzerbaijanBahamas, TheBahrainBangladeshBarbadosBelarusBelgiumBelizeBeninBermudaBhutanBoliviaBosnia and HerzegovinaBotswanaBrazilBrunei DarussalamBulgariaBurkina FasoBurundiCabo VerdeCambodiaCameroonCanadaCaribbean small statesCentral African RepublicCentral Europe and the BalticsChadChannel IslandsChileChinaColombiaComorosCongo, Dem. Rep.Congo, Rep.Costa RicaCote d'IvoireCroatiaCubaCuracaoCyprusCzech RepublicDenmarkDjiboutiDominicaDominican RepublicEarly-demographic dividendEast Asia & PacificEast Asia & Pacific (excluding high income)East Asia & Pacific (IDA & IBRD countries)EcuadorEgypt, Arab Rep.El SalvadorEquatorial GuineaEritreaEstoniaEthiopiaEuro areaEurope & Central AsiaEurope & Central Asia (excluding high income)Europe & Central Asia (IDA & IBRD countries)European UnionFaroe IslandsFijiFinlandFragile and conflict affected situationsFranceFrench PolynesiaGabonGambia, TheGeorgiaGermanyGhanaGreeceGreenlandGrenadaGuamGuatemalaGuineaGuinea-BissauGuyanaHaitiHeavily indebted poor countries (HIPC)High incomeHondurasHong Kong SAR, ChinaHungaryIBRD onlyIcelandIDA & IBRD totalIDA blendIDA onlyIDA totalIndiaIndonesiaIran, Islamic Rep.IraqIrelandIsle of ManIsraelItalyJamaicaJapanJordanKazakhstanKenyaKiribatiKorea, Dem. People’s Rep.Korea, Rep.KosovoKuwaitKyrgyz RepublicLao PDRLate-demographic dividendLatin America & Caribbean Latin America & Caribbean (excluding high income)Latin America & the Caribbean (IDA & IBRD countries)LatviaLeast developed countries: UN classificationLebanonLesothoLiberiaLibyaLiechtensteinLithuaniaLow & middle incomeLow incomeLower middle incomeLuxembourgMacao SAR, ChinaMacedonia, FYRMadagascarMalawiMalaysiaMaldivesMaliMaltaMarshall IslandsMauritaniaMauritiusMexicoMicronesia, Fed. Sts.Middle East & North AfricaMiddle East & North Africa (excluding high income)Middle East & North Africa (IDA & IBRD countries)Middle incomeMoldovaMongoliaMontenegroMoroccoMozambiqueMyanmarNamibiaNepalNetherlandsNew CaledoniaNew ZealandNicaraguaNigerNigeriaNorth AmericaNorwayOECD membersOmanOther small statesPacific island small statesPakistanPalauPanamaPapua New GuineaParaguayPeruPhilippinesPolandPortugalPost-demographic dividendPre-demographic dividendPuerto RicoQatarRomaniaRussian FederationRwandaSamoaSan MarinoSao Tome and PrincipeSaudi ArabiaSenegalSerbiaSeychellesSierra LeoneSingaporeSint Maarten (Dutch part)Slovak RepublicSloveniaSmall statesSolomon IslandsSomaliaSouth AfricaSouth AsiaSouth Asia (IDA & IBRD)South SudanSpainSri LankaSt. Kitts and NevisSt. LuciaSt. Martin (French part)St. Vincent and the GrenadinesSub-Saharan Africa Sub-Saharan Africa (excluding high income)Sub-Saharan Africa (IDA & IBRD countries)SudanSurinameSwazilandSwedenSwitzerlandSyrian Arab RepublicTajikistanTanzaniaThailandTimor-LesteTogoTongaTrinidad and TobagoTunisiaTurkeyTurkmenistanUgandaUkraineUnited Arab EmiratesUnited KingdomUnited StatesUpper middle incomeUruguayUzbekistanVanuatuVenezuela, RBVietnamVirgin Islands (U.S.)West Bank and GazaWorldYemen, Rep.ZambiaZimbabwe Zeitlinie:
Diese Zeitleiste vorliegt die Graphik ab 1961 J. bis 2015 J. Fragile and conflict affected situations. Die Angaben bis 1960 J. sind nicht vorhanden. Die Zahl aktueller Beobachtungen nach Daten: 55.
Die Quelle (Bezeichnung):
Kennzahlen der Weltentwicklung
Die Quelle (Einrichtung):
Derived from male and female life expectancy at birth from sources such as: (1) United Nations Population Division. World Population Prospects, (2) Census reports and other statistical publications from national statistical offices, (3) Eurostat: Demographic Statistics, (4) United Nations Statistical Division. Population and Vital Statistics Reprot (various years), (5) U.S. Census Bureau: International Database, and (6) Secretariat of the Pacific Community: Statistics and Demography Programme.
Kategorien:
Health
Es wurde aktualisiert:
23 Apr 2017 Jahr
Kennzahlen der Wertänderungen vom Jahr zum Jahr
Minimum:
40.882
1 Jan 1961 Jahr
Maximum:
61.721
1 Jan 2015 Jahr
Zum Datum der Beobachtung
Wert
Absolute Veränderung
Die Veränderung bezüglich dem vorherigen Wert
1 Jan 1961 Jahr
40.882
+40.882
0.0%
1 Jan 1962 Jahr
41.397
+0.515
1.26%
1 Jan 1963 Jahr
41.936
+0.539
1.3%
1 Jan 1964 Jahr
42.506
+0.57
1.36%
1 Jan 1965 Jahr
43.105
+0.599
1.41%
1 Jan 1966 Jahr
43.727
+0.622
1.44%
1 Jan 1967 Jahr
44.358
+0.632
1.44%
1 Jan 1968 Jahr
44.983
+0.625
1.41%
1 Jan 1969 Jahr
45.588
+0.605
1.34%
1 Jan 1970 Jahr
46.167
+0.579
1.27%
1 Jan 1971 Jahr
46.718
+0.551
1.19%
1 Jan 1972 Jahr
47.244
+0.526
1.13%
1 Jan 1973 Jahr
47.752
+0.509
1.08%
1 Jan 1974 Jahr
48.247
+0.495
1.04%
1 Jan 1975 Jahr
48.727
+0.479
0.99%
1 Jan 1976 Jahr
49.188
+0.461
0.95%
1 Jan 1977 Jahr
49.627
+0.439
0.89%
1 Jan 1978 Jahr
50.042
+0.416
0.84%
1 Jan 1979 Jahr
50.441
+0.399
0.8%
1 Jan 1980 Jahr
50.832
+0.391
0.78%
1 Jan 1981 Jahr
51.226
+0.393
0.77%
1 Jan 1982 Jahr
51.737
+0.511
1.0%
1 Jan 1983 Jahr
52.151
+0.414
0.8%
1 Jan 1984 Jahr
52.572
+0.421
0.81%
1 Jan 1985 Jahr
52.991
+0.419
0.8%
1 Jan 1986 Jahr
53.397
+0.406
0.77%
1 Jan 1987 Jahr
53.781
+0.384
0.72%
1 Jan 1988 Jahr
54.139
+0.357
0.66%
1 Jan 1989 Jahr
54.454
+0.315
0.58%
1 Jan 1990 Jahr
54.736
+0.282
0.52%
1 Jan 1991 Jahr
55.082
+0.346
0.63%
1 Jan 1992 Jahr
55.293
+0.211
0.38%
1 Jan 1993 Jahr
55.471
+0.178
0.32%
1 Jan 1994 Jahr
55.625
+0.154
0.28%
1 Jan 1995 Jahr
55.761
+0.136
0.24%
1 Jan 1996 Jahr
55.888
+0.127
0.23%
1 Jan 1997 Jahr
56.018
+0.13
0.23%
1 Jan 1998 Jahr
56.161
+0.143
0.25%
1 Jan 1999 Jahr
56.318
+0.157
0.28%
1 Jan 2000 Jahr
56.491
+0.174
0.31%
1 Jan 2001 Jahr
56.722
+0.231
0.41%
1 Jan 2002 Jahr
56.99
+0.268
0.47%
1 Jan 2003 Jahr
57.297
+0.306
0.54%
1 Jan 2004 Jahr
57.637
+0.34
0.59%
1 Jan 2005 Jahr
58.005
+0.368
0.64%
1 Jan 2006 Jahr
58.394
+0.389
0.67%
1 Jan 2007 Jahr
58.799
+0.404
0.69%
1 Jan 2008 Jahr
59.208
+0.409
0.7%
1 Jan 2009 Jahr
59.611
+0.403
0.68%
1 Jan 2010 Jahr
59.999
+0.388
0.65%
1 Jan 2011 Jahr
60.368
+0.369
0.62%
1 Jan 2012 Jahr
60.72
+0.351
0.58%
1 Jan 2013 Jahr
61.061
+0.341
0.56%
1 Jan 2014 Jahr
61.394
+0.334
0.55%
1 Jan 2015 Jahr
61.721
+0.327
0.53%
Bewertung der Länder gemäß mit laufender Statistik nach Jahren


Kommentare: