29
/de/
de
AIzaSyAYiBZKx7MnpbEhh9jyipgxe19OcubqV5w
April 1, 2024
103824
Chad
TCD
true
2
1
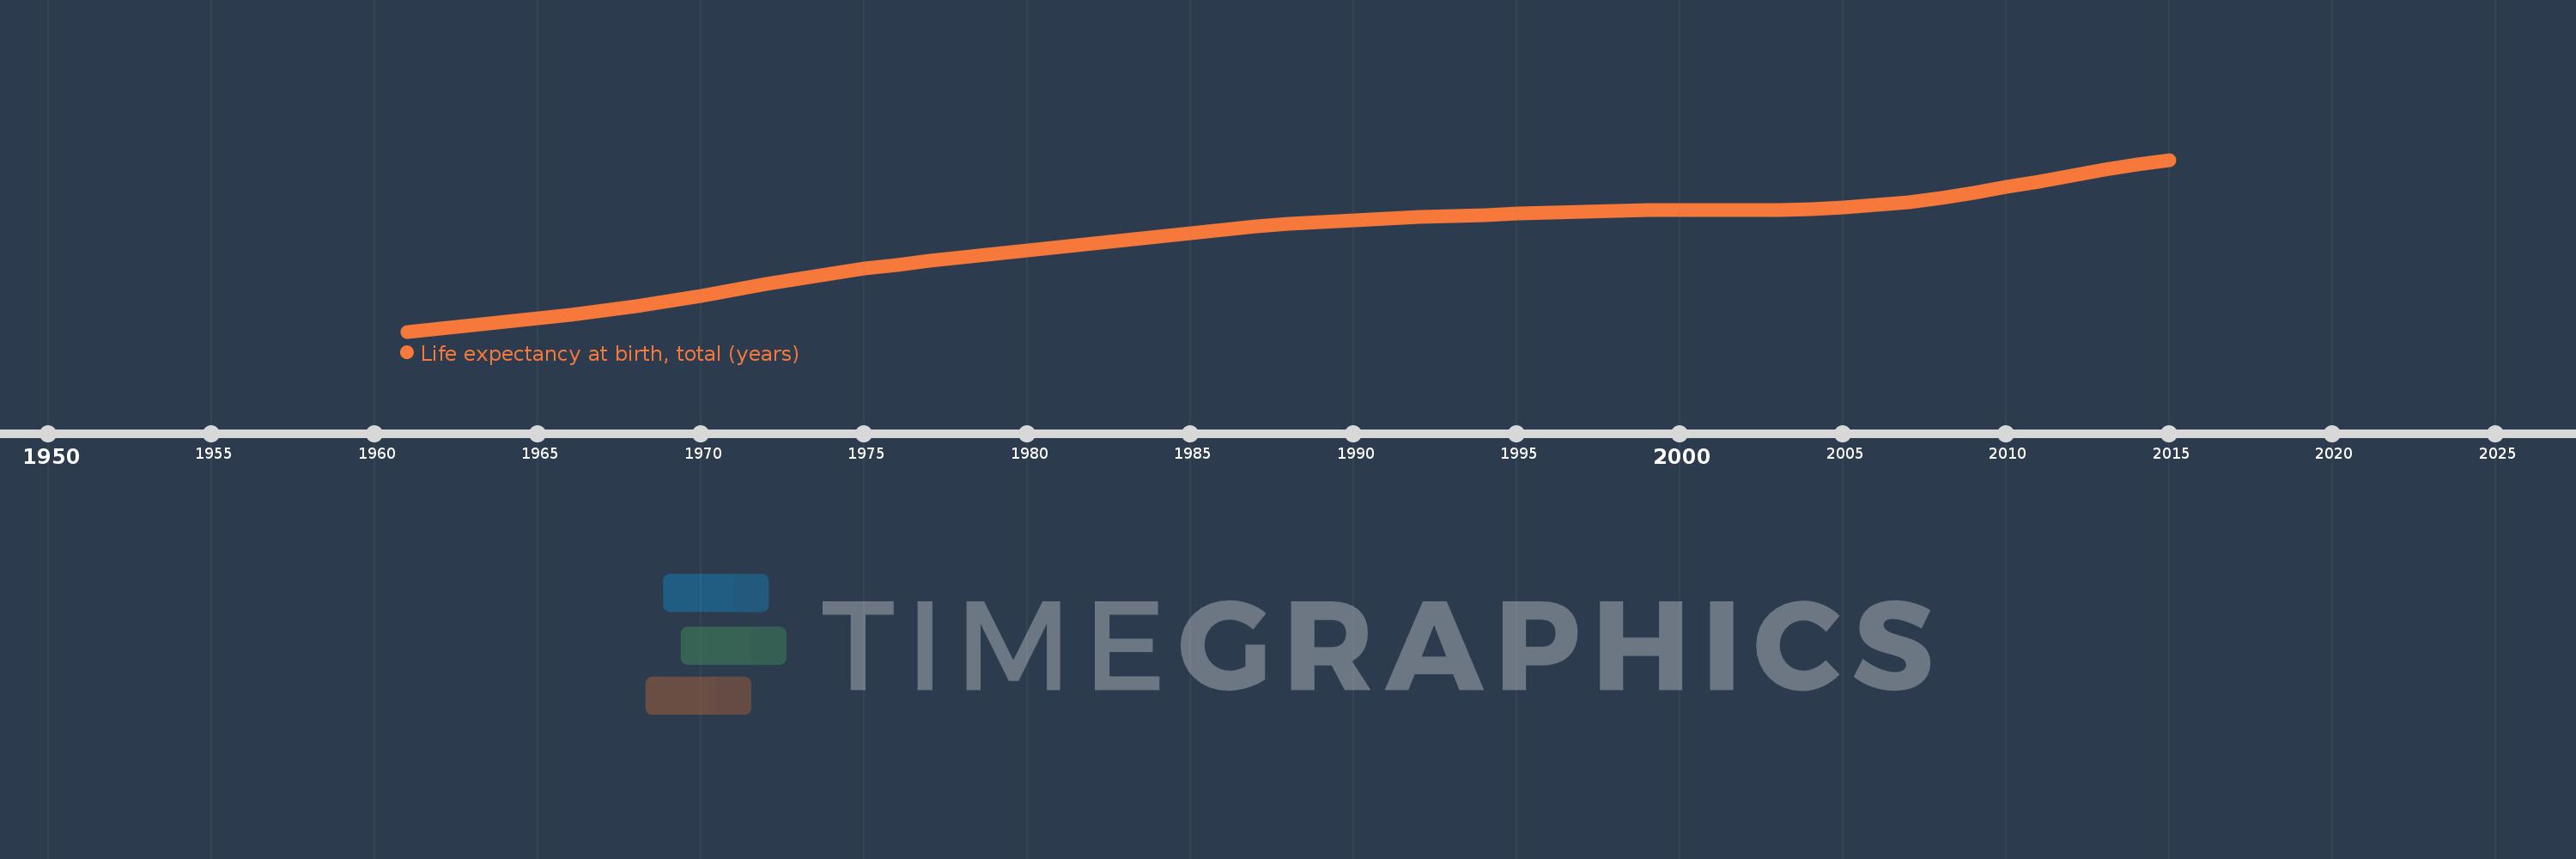
Life expectancy at birth, total (years)
2015,2014,2013,2012,2011,2010,2009,2008,2007,2006,2005,2004,2003,2002,2001,2000,1999,1998,1997,1996,1995,1994,1993,1992,1991,1990,1989,1988,1987,1986,1985,1984,1983,1982,1981,1980,1979,1978,1977,1976,1975,1974,1973,1972,1971,1970,1969,1968,1967,1966,1965,1964,1963,1962,1961
Diese Statistik in anderen Ländern:
AfghanistanAlbaniaAlgeriaAngolaAntigua and BarbudaArab WorldArgentinaArmeniaArubaAustraliaAustriaAzerbaijanBahamas, TheBahrainBangladeshBarbadosBelarusBelgiumBelizeBeninBermudaBhutanBoliviaBosnia and HerzegovinaBotswanaBrazilBrunei DarussalamBulgariaBurkina FasoBurundiCabo VerdeCambodiaCameroonCanadaCaribbean small statesCentral African RepublicCentral Europe and the BalticsChadChannel IslandsChileChinaColombiaComorosCongo, Dem. Rep.Congo, Rep.Costa RicaCote d'IvoireCroatiaCubaCuracaoCyprusCzech RepublicDenmarkDjiboutiDominicaDominican RepublicEarly-demographic dividendEast Asia & PacificEast Asia & Pacific (excluding high income)East Asia & Pacific (IDA & IBRD countries)EcuadorEgypt, Arab Rep.El SalvadorEquatorial GuineaEritreaEstoniaEthiopiaEuro areaEurope & Central AsiaEurope & Central Asia (excluding high income)Europe & Central Asia (IDA & IBRD countries)European UnionFaroe IslandsFijiFinlandFragile and conflict affected situationsFranceFrench PolynesiaGabonGambia, TheGeorgiaGermanyGhanaGreeceGreenlandGrenadaGuamGuatemalaGuineaGuinea-BissauGuyanaHaitiHeavily indebted poor countries (HIPC)High incomeHondurasHong Kong SAR, ChinaHungaryIBRD onlyIcelandIDA & IBRD totalIDA blendIDA onlyIDA totalIndiaIndonesiaIran, Islamic Rep.IraqIrelandIsle of ManIsraelItalyJamaicaJapanJordanKazakhstanKenyaKiribatiKorea, Dem. People’s Rep.Korea, Rep.KosovoKuwaitKyrgyz RepublicLao PDRLate-demographic dividendLatin America & Caribbean Latin America & Caribbean (excluding high income)Latin America & the Caribbean (IDA & IBRD countries)LatviaLeast developed countries: UN classificationLebanonLesothoLiberiaLibyaLiechtensteinLithuaniaLow & middle incomeLow incomeLower middle incomeLuxembourgMacao SAR, ChinaMacedonia, FYRMadagascarMalawiMalaysiaMaldivesMaliMaltaMarshall IslandsMauritaniaMauritiusMexicoMicronesia, Fed. Sts.Middle East & North AfricaMiddle East & North Africa (excluding high income)Middle East & North Africa (IDA & IBRD countries)Middle incomeMoldovaMongoliaMontenegroMoroccoMozambiqueMyanmarNamibiaNepalNetherlandsNew CaledoniaNew ZealandNicaraguaNigerNigeriaNorth AmericaNorwayOECD membersOmanOther small statesPacific island small statesPakistanPalauPanamaPapua New GuineaParaguayPeruPhilippinesPolandPortugalPost-demographic dividendPre-demographic dividendPuerto RicoQatarRomaniaRussian FederationRwandaSamoaSan MarinoSao Tome and PrincipeSaudi ArabiaSenegalSerbiaSeychellesSierra LeoneSingaporeSint Maarten (Dutch part)Slovak RepublicSloveniaSmall statesSolomon IslandsSomaliaSouth AfricaSouth AsiaSouth Asia (IDA & IBRD)South SudanSpainSri LankaSt. Kitts and NevisSt. LuciaSt. Martin (French part)St. Vincent and the GrenadinesSub-Saharan Africa Sub-Saharan Africa (excluding high income)Sub-Saharan Africa (IDA & IBRD countries)SudanSurinameSwazilandSwedenSwitzerlandSyrian Arab RepublicTajikistanTanzaniaThailandTimor-LesteTogoTongaTrinidad and TobagoTunisiaTurkeyTurkmenistanUgandaUkraineUnited Arab EmiratesUnited KingdomUnited StatesUpper middle incomeUruguayUzbekistanVanuatuVenezuela, RBVietnamVirgin Islands (U.S.)West Bank and GazaWorldYemen, Rep.ZambiaZimbabwe Zeitlinie:
Diese Zeitleiste vorliegt die Graphik ab 1961 J. bis 2015 J. Chad. Die Angaben bis 1960 J. sind nicht vorhanden. Die Zahl aktueller Beobachtungen nach Daten: 55.
Die Quelle (Bezeichnung):
Kennzahlen der Weltentwicklung
Die Quelle (Einrichtung):
Derived from male and female life expectancy at birth from sources such as: (1) United Nations Population Division. World Population Prospects, (2) Census reports and other statistical publications from national statistical offices, (3) Eurostat: Demographic Statistics, (4) United Nations Statistical Division. Population and Vital Statistics Reprot (various years), (5) U.S. Census Bureau: International Database, and (6) Secretariat of the Pacific Community: Statistics and Demography Programme.
Kategorien:
Health
Es wurde aktualisiert:
23 Apr 2017 Jahr
Kennzahlen der Wertänderungen vom Jahr zum Jahr
Minimum:
38.016
1 Jan 1961 Jahr
Maximum:
51.556
1 Jan 2015 Jahr
Zum Datum der Beobachtung
Wert
Absolute Veränderung
Die Veränderung bezüglich dem vorherigen Wert
1 Jan 1961 Jahr
38.016
+38.016
0.0%
1 Jan 1962 Jahr
38.273
+0.257
0.68%
1 Jan 1963 Jahr
38.529
+0.255
0.67%
1 Jan 1964 Jahr
38.786
+0.257
0.67%
1 Jan 1965 Jahr
39.05
+0.264
0.68%
1 Jan 1966 Jahr
39.333
+0.283
0.73%
1 Jan 1967 Jahr
39.651
+0.318
0.81%
1 Jan 1968 Jahr
40.011
+0.36
0.91%
1 Jan 1969 Jahr
40.412
+0.401
1.0%
1 Jan 1970 Jahr
40.848
+0.436
1.08%
1 Jan 1971 Jahr
41.305
+0.457
1.12%
1 Jan 1972 Jahr
41.761
+0.457
1.11%
1 Jan 1973 Jahr
42.199
+0.438
1.05%
1 Jan 1974 Jahr
42.604
+0.405
0.96%
1 Jan 1975 Jahr
42.968
+0.364
0.85%
1 Jan 1976 Jahr
43.293
+0.325
0.76%
1 Jan 1977 Jahr
43.586
+0.293
0.68%
1 Jan 1978 Jahr
43.861
+0.275
0.63%
1 Jan 1979 Jahr
44.131
+0.27
0.62%
1 Jan 1980 Jahr
44.401
+0.27
0.61%
1 Jan 1981 Jahr
44.675
+0.274
0.62%
1 Jan 1982 Jahr
44.957
+0.282
0.63%
1 Jan 1983 Jahr
45.241
+0.284
0.63%
1 Jan 1984 Jahr
45.521
+0.28
0.62%
1 Jan 1985 Jahr
45.795
+0.273
0.6%
1 Jan 1986 Jahr
46.053
+0.258
0.56%
1 Jan 1987 Jahr
46.287
+0.234
0.51%
1 Jan 1988 Jahr
46.491
+0.204
0.44%
1 Jan 1989 Jahr
46.664
+0.173
0.37%
1 Jan 1990 Jahr
46.807
+0.143
0.31%
1 Jan 1991 Jahr
46.924
+0.118
0.25%
1 Jan 1992 Jahr
47.027
+0.102
0.22%
1 Jan 1993 Jahr
47.122
+0.095
0.2%
1 Jan 1994 Jahr
47.217
+0.095
0.2%
1 Jan 1995 Jahr
47.313
+0.097
0.2%
1 Jan 1996 Jahr
47.405
+0.091
0.19%
1 Jan 1997 Jahr
47.481
+0.076
0.16%
1 Jan 1998 Jahr
47.534
+0.053
0.11%
1 Jan 1999 Jahr
47.563
+0.03
0.06%
1 Jan 2000 Jahr
47.574
+0.011
0.02%
1 Jan 2001 Jahr
47.578
+0.004
0.01%
1 Jan 2002 Jahr
47.587
+0.009
0.02%
1 Jan 2003 Jahr
47.616
+0.029
0.06%
1 Jan 2004 Jahr
47.682
+0.066
0.14%
1 Jan 2005 Jahr
47.796
+0.114
0.24%
1 Jan 2006 Jahr
47.974
+0.178
0.37%
1 Jan 2007 Jahr
48.23
+0.256
0.53%
1 Jan 2008 Jahr
48.559
+0.329
0.68%
1 Jan 2009 Jahr
48.952
+0.392
0.81%
1 Jan 2010 Jahr
49.393
+0.442
0.9%
1 Jan 2011 Jahr
49.862
+0.469
0.95%
1 Jan 2012 Jahr
50.332
+0.47
0.94%
1 Jan 2013 Jahr
50.781
+0.449
0.89%
1 Jan 2014 Jahr
51.191
+0.41
0.81%
1 Jan 2015 Jahr
51.556
+0.364
0.71%
Bewertung der Länder gemäß mit laufender Statistik nach Jahren


Kommentare: