29
/de/
de
AIzaSyAYiBZKx7MnpbEhh9jyipgxe19OcubqV5w
April 1, 2024
30844
Europe & Central Asia
ECS
false
2
1
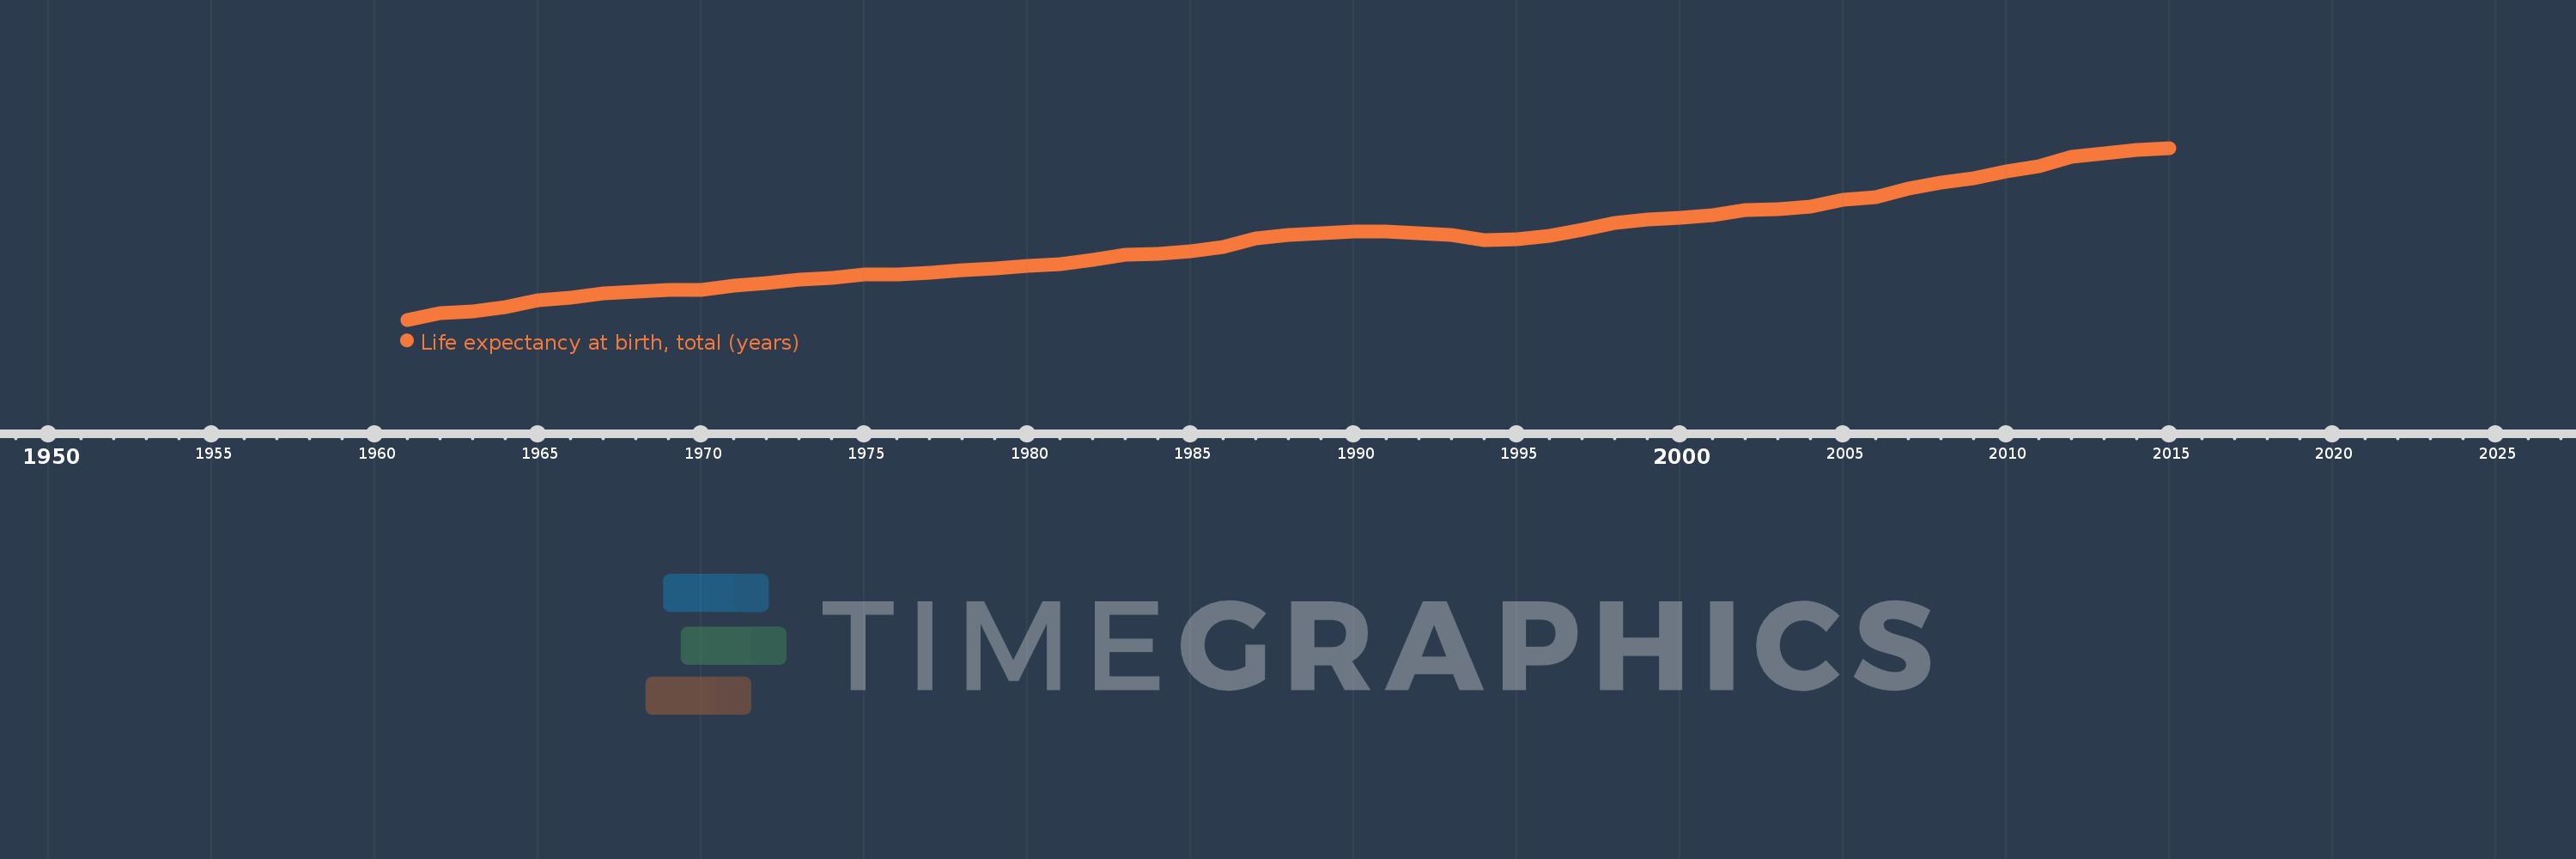
Life expectancy at birth, total (years)
2015,2014,2013,2012,2011,2010,2009,2008,2007,2006,2005,2004,2003,2002,2001,2000,1999,1998,1997,1996,1995,1994,1993,1992,1991,1990,1989,1988,1987,1986,1985,1984,1983,1982,1981,1980,1979,1978,1977,1976,1975,1974,1973,1972,1971,1970,1969,1968,1967,1966,1965,1964,1963,1962,1961
Diese Statistik in anderen Ländern:
AfghanistanAlbaniaAlgeriaAngolaAntigua and BarbudaArab WorldArgentinaArmeniaArubaAustraliaAustriaAzerbaijanBahamas, TheBahrainBangladeshBarbadosBelarusBelgiumBelizeBeninBermudaBhutanBoliviaBosnia and HerzegovinaBotswanaBrazilBrunei DarussalamBulgariaBurkina FasoBurundiCabo VerdeCambodiaCameroonCanadaCaribbean small statesCentral African RepublicCentral Europe and the BalticsChadChannel IslandsChileChinaColombiaComorosCongo, Dem. Rep.Congo, Rep.Costa RicaCote d'IvoireCroatiaCubaCuracaoCyprusCzech RepublicDenmarkDjiboutiDominicaDominican RepublicEarly-demographic dividendEast Asia & PacificEast Asia & Pacific (excluding high income)East Asia & Pacific (IDA & IBRD countries)EcuadorEgypt, Arab Rep.El SalvadorEquatorial GuineaEritreaEstoniaEthiopiaEuro areaEurope & Central AsiaEurope & Central Asia (excluding high income)Europe & Central Asia (IDA & IBRD countries)European UnionFaroe IslandsFijiFinlandFragile and conflict affected situationsFranceFrench PolynesiaGabonGambia, TheGeorgiaGermanyGhanaGreeceGreenlandGrenadaGuamGuatemalaGuineaGuinea-BissauGuyanaHaitiHeavily indebted poor countries (HIPC)High incomeHondurasHong Kong SAR, ChinaHungaryIBRD onlyIcelandIDA & IBRD totalIDA blendIDA onlyIDA totalIndiaIndonesiaIran, Islamic Rep.IraqIrelandIsle of ManIsraelItalyJamaicaJapanJordanKazakhstanKenyaKiribatiKorea, Dem. People’s Rep.Korea, Rep.KosovoKuwaitKyrgyz RepublicLao PDRLate-demographic dividendLatin America & Caribbean Latin America & Caribbean (excluding high income)Latin America & the Caribbean (IDA & IBRD countries)LatviaLeast developed countries: UN classificationLebanonLesothoLiberiaLibyaLiechtensteinLithuaniaLow & middle incomeLow incomeLower middle incomeLuxembourgMacao SAR, ChinaMacedonia, FYRMadagascarMalawiMalaysiaMaldivesMaliMaltaMarshall IslandsMauritaniaMauritiusMexicoMicronesia, Fed. Sts.Middle East & North AfricaMiddle East & North Africa (excluding high income)Middle East & North Africa (IDA & IBRD countries)Middle incomeMoldovaMongoliaMontenegroMoroccoMozambiqueMyanmarNamibiaNepalNetherlandsNew CaledoniaNew ZealandNicaraguaNigerNigeriaNorth AmericaNorwayOECD membersOmanOther small statesPacific island small statesPakistanPalauPanamaPapua New GuineaParaguayPeruPhilippinesPolandPortugalPost-demographic dividendPre-demographic dividendPuerto RicoQatarRomaniaRussian FederationRwandaSamoaSan MarinoSao Tome and PrincipeSaudi ArabiaSenegalSerbiaSeychellesSierra LeoneSingaporeSint Maarten (Dutch part)Slovak RepublicSloveniaSmall statesSolomon IslandsSomaliaSouth AfricaSouth AsiaSouth Asia (IDA & IBRD)South SudanSpainSri LankaSt. Kitts and NevisSt. LuciaSt. Martin (French part)St. Vincent and the GrenadinesSub-Saharan Africa Sub-Saharan Africa (excluding high income)Sub-Saharan Africa (IDA & IBRD countries)SudanSurinameSwazilandSwedenSwitzerlandSyrian Arab RepublicTajikistanTanzaniaThailandTimor-LesteTogoTongaTrinidad and TobagoTunisiaTurkeyTurkmenistanUgandaUkraineUnited Arab EmiratesUnited KingdomUnited StatesUpper middle incomeUruguayUzbekistanVanuatuVenezuela, RBVietnamVirgin Islands (U.S.)West Bank and GazaWorldYemen, Rep.ZambiaZimbabwe Zeitlinie:
Diese Zeitleiste vorliegt die Graphik ab 1961 J. bis 2015 J. Europe & Central Asia. Die Angaben bis 1960 J. sind nicht vorhanden. Die Zahl aktueller Beobachtungen nach Daten: 55.
Die Quelle (Bezeichnung):
Kennzahlen der Weltentwicklung
Die Quelle (Einrichtung):
Derived from male and female life expectancy at birth from sources such as: (1) United Nations Population Division. World Population Prospects, (2) Census reports and other statistical publications from national statistical offices, (3) Eurostat: Demographic Statistics, (4) United Nations Statistical Division. Population and Vital Statistics Reprot (various years), (5) U.S. Census Bureau: International Database, and (6) Secretariat of the Pacific Community: Statistics and Demography Programme.
Kategorien:
Health
Es wurde aktualisiert:
23 Apr 2017 Jahr
Kennzahlen der Wertänderungen vom Jahr zum Jahr
Minimum:
67.03
1 Jan 1961 Jahr
Maximum:
76.892
1 Jan 2015 Jahr
Zum Datum der Beobachtung
Wert
Absolute Veränderung
Die Veränderung bezüglich dem vorherigen Wert
1 Jan 1961 Jahr
67.03
+67.03
0.0%
1 Jan 1962 Jahr
67.395
+0.365
0.54%
1 Jan 1963 Jahr
67.489
+0.095
0.14%
1 Jan 1964 Jahr
67.76
+0.271
0.4%
1 Jan 1965 Jahr
68.158
+0.398
0.59%
1 Jan 1966 Jahr
68.311
+0.153
0.22%
1 Jan 1967 Jahr
68.523
+0.212
0.31%
1 Jan 1968 Jahr
68.649
+0.126
0.18%
1 Jan 1969 Jahr
68.721
+0.072
0.11%
1 Jan 1970 Jahr
68.729
+0.008
0.01%
1 Jan 1971 Jahr
69.009
+0.28
0.41%
1 Jan 1972 Jahr
69.146
+0.137
0.2%
1 Jan 1973 Jahr
69.349
+0.203
0.29%
1 Jan 1974 Jahr
69.444
+0.094
0.14%
1 Jan 1975 Jahr
69.646
+0.202
0.29%
1 Jan 1976 Jahr
69.619
-0.027
-0.04%
1 Jan 1977 Jahr
69.719
+0.1
0.14%
1 Jan 1978 Jahr
69.892
+0.172
0.25%
1 Jan 1979 Jahr
69.982
+0.09
0.13%
1 Jan 1980 Jahr
70.101
+0.119
0.17%
1 Jan 1981 Jahr
70.205
+0.104
0.15%
1 Jan 1982 Jahr
70.47
+0.266
0.38%
1 Jan 1983 Jahr
70.762
+0.291
0.41%
1 Jan 1984 Jahr
70.832
+0.07
0.1%
1 Jan 1985 Jahr
70.983
+0.151
0.21%
1 Jan 1986 Jahr
71.196
+0.213
0.3%
1 Jan 1987 Jahr
71.68
+0.484
0.68%
1 Jan 1988 Jahr
71.894
+0.214
0.3%
1 Jan 1989 Jahr
72.017
+0.124
0.17%
1 Jan 1990 Jahr
72.076
+0.059
0.08%
1 Jan 1991 Jahr
72.075
-0.001
0.0%
1 Jan 1992 Jahr
71.981
-0.093
-0.13%
1 Jan 1993 Jahr
71.907
-0.074
-0.1%
1 Jan 1994 Jahr
71.585
-0.321
-0.45%
1 Jan 1995 Jahr
71.651
+0.066
0.09%
1 Jan 1996 Jahr
71.841
+0.19
0.27%
1 Jan 1997 Jahr
72.195
+0.354
0.49%
1 Jan 1998 Jahr
72.584
+0.389
0.54%
1 Jan 1999 Jahr
72.805
+0.221
0.3%
1 Jan 2000 Jahr
72.907
+0.102
0.14%
1 Jan 2001 Jahr
73.025
+0.118
0.16%
1 Jan 2002 Jahr
73.341
+0.316
0.43%
1 Jan 2003 Jahr
73.4
+0.059
0.08%
1 Jan 2004 Jahr
73.508
+0.108
0.15%
1 Jan 2005 Jahr
73.935
+0.427
0.58%
1 Jan 2006 Jahr
74.09
+0.155
0.21%
1 Jan 2007 Jahr
74.574
+0.484
0.65%
1 Jan 2008 Jahr
74.921
+0.348
0.47%
1 Jan 2009 Jahr
75.167
+0.246
0.33%
1 Jan 2010 Jahr
75.552
+0.385
0.51%
1 Jan 2011 Jahr
75.845
+0.292
0.39%
1 Jan 2012 Jahr
76.374
+0.529
0.7%
1 Jan 2013 Jahr
76.558
+0.185
0.24%
1 Jan 2014 Jahr
76.789
+0.231
0.3%
1 Jan 2015 Jahr
76.892
+0.103
0.13%
Bewertung der Länder gemäß mit laufender Statistik nach Jahren


Kommentare: