29
/de/
de
AIzaSyAYiBZKx7MnpbEhh9jyipgxe19OcubqV5w
April 1, 2024
32591
Europe & Central Asia (IDA & IBRD countries)
TEC
false
2
1
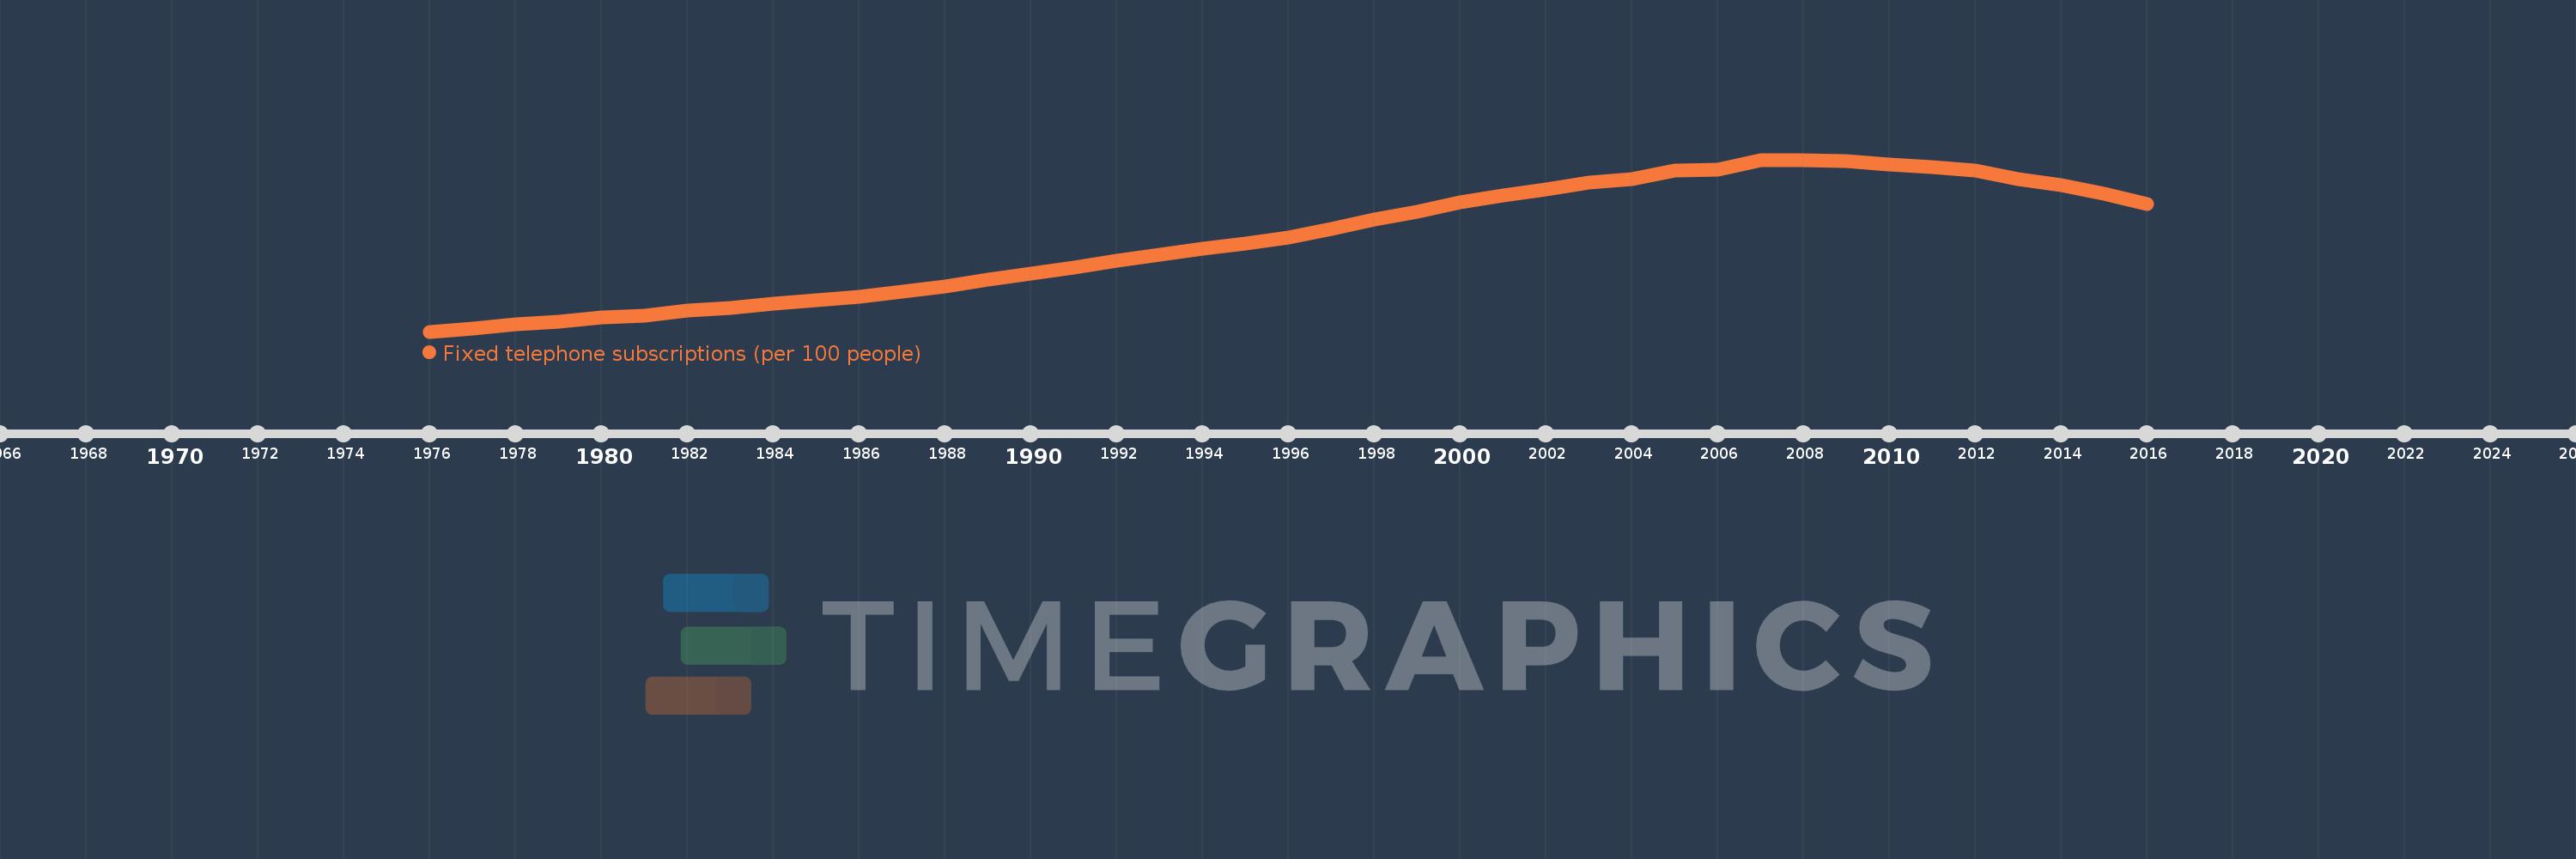
Fixed telephone subscriptions (per 100 people)
2016,2015,2014,2013,2012,2011,2010,2009,2008,2007,2006,2005,2004,2003,2002,2001,2000,1999,1998,1997,1996,1995,1994,1993,1992,1991,1990,1989,1988,1987,1986,1985,1984,1983,1982,1981,1980,1979,1978,1977,1976
Diese Statistik in anderen Ländern:
AfghanistanAlbaniaAlgeriaAmerican SamoaAndorraAngolaAntigua and BarbudaArab WorldArgentinaArmeniaArubaAustraliaAustriaAzerbaijanBahamas, TheBahrainBangladeshBarbadosBelarusBelgiumBelizeBeninBermudaBhutanBoliviaBosnia and HerzegovinaBotswanaBrazilBritish Virgin IslandsBrunei DarussalamBulgariaBurkina FasoBurundiCabo VerdeCambodiaCameroonCanadaCaribbean small statesCayman IslandsCentral African RepublicCentral Europe and the BalticsChadChileChinaColombiaComorosCongo, Dem. Rep.Congo, Rep.Costa RicaCote d'IvoireCroatiaCubaCuracaoCyprusCzech RepublicDenmarkDjiboutiDominicaDominican RepublicEarly-demographic dividendEast Asia & PacificEast Asia & Pacific (excluding high income)East Asia & Pacific (IDA & IBRD countries)EcuadorEgypt, Arab Rep.El SalvadorEquatorial GuineaEritreaEstoniaEthiopiaEuro areaEurope & Central AsiaEurope & Central Asia (excluding high income)Europe & Central Asia (IDA & IBRD countries)European UnionFaroe IslandsFijiFinlandFragile and conflict affected situationsFranceFrench PolynesiaGabonGambia, TheGeorgiaGermanyGhanaGibraltarGreeceGreenlandGrenadaGuamGuatemalaGuineaGuinea-BissauGuyanaHaitiHeavily indebted poor countries (HIPC)High incomeHondurasHong Kong SAR, ChinaHungaryIBRD onlyIcelandIDA & IBRD totalIDA blendIDA onlyIDA totalIndiaIndonesiaIran, Islamic Rep.IraqIrelandIsraelItalyJamaicaJapanJordanKazakhstanKenyaKiribatiKorea, Dem. People’s Rep.Korea, Rep.KosovoKuwaitKyrgyz RepublicLao PDRLate-demographic dividendLatin America & Caribbean Latin America & Caribbean (excluding high income)Latin America & the Caribbean (IDA & IBRD countries)LatviaLeast developed countries: UN classificationLebanonLesothoLiberiaLibyaLiechtensteinLithuaniaLow & middle incomeLow incomeLower middle incomeLuxembourgMacao SAR, ChinaMacedonia, FYRMadagascarMalawiMalaysiaMaldivesMaliMaltaMarshall IslandsMauritaniaMauritiusMexicoMicronesia, Fed. Sts.Middle East & North AfricaMiddle East & North Africa (excluding high income)Middle East & North Africa (IDA & IBRD countries)Middle incomeMoldovaMonacoMongoliaMontenegroMoroccoMozambiqueMyanmarNamibiaNauruNepalNetherlandsNew CaledoniaNew ZealandNicaraguaNigerNigeriaNorth AmericaNorthern Mariana IslandsNorwayOECD membersOmanOther small statesPacific island small statesPakistanPalauPanamaPapua New GuineaParaguayPeruPhilippinesPolandPortugalPost-demographic dividendPre-demographic dividendPuerto RicoQatarRomaniaRussian FederationRwandaSamoaSan MarinoSao Tome and PrincipeSaudi ArabiaSenegalSerbiaSeychellesSierra LeoneSingaporeSlovak RepublicSloveniaSmall statesSolomon IslandsSomaliaSouth AfricaSouth AsiaSouth Asia (IDA & IBRD)South SudanSpainSri LankaSt. Kitts and NevisSt. LuciaSt. Vincent and the GrenadinesSub-Saharan Africa Sub-Saharan Africa (excluding high income)Sub-Saharan Africa (IDA & IBRD countries)SudanSurinameSwazilandSwedenSwitzerlandSyrian Arab RepublicTajikistanTanzaniaThailandTimor-LesteTogoTongaTrinidad and TobagoTunisiaTurkeyTurkmenistanTurks and Caicos IslandsTuvaluUgandaUkraineUnited Arab EmiratesUnited KingdomUnited StatesUpper middle incomeUruguayUzbekistanVanuatuVenezuela, RBVietnamVirgin Islands (U.S.)West Bank and GazaWorldYemen, Rep.ZambiaZimbabwe Zeitlinie:
Diese Zeitleiste vorliegt die Graphik ab 1976 J. bis 2016 J. Europe & Central Asia (IDA & IBRD countries). Die Angaben bis 1975 J. sind nicht vorhanden. Die Zahl aktueller Beobachtungen nach Daten: 41.
Die Quelle (Bezeichnung):
Kennzahlen der Weltentwicklung
Die Quelle (Einrichtung):
International Telecommunication Union, World Telecommunication/ICT Development Report and database.
Kategorien:
Infrastructure
Es wurde aktualisiert:
23 Apr 2017 Jahr
Kennzahlen der Wertänderungen vom Jahr zum Jahr
Minimum:
4.064
1 Jan 1976 Jahr
Maximum:
25.956
1 Jan 2007 Jahr
Zum Datum der Beobachtung
Wert
Absolute Veränderung
Die Veränderung bezüglich dem vorherigen Wert
1 Jan 1976 Jahr
4.064
+4.064
0.0%
1 Jan 1977 Jahr
4.446
+0.381
9.38%
1 Jan 1978 Jahr
4.976
+0.53
11.93%
1 Jan 1979 Jahr
5.355
+0.379
7.62%
1 Jan 1980 Jahr
5.837
+0.481
8.99%
1 Jan 1981 Jahr
6.135
+0.298
5.11%
1 Jan 1982 Jahr
6.713
+0.578
9.43%
1 Jan 1983 Jahr
7.098
+0.384
5.72%
1 Jan 1984 Jahr
7.572
+0.475
6.69%
1 Jan 1985 Jahr
8.041
+0.469
6.19%
1 Jan 1986 Jahr
8.521
+0.48
5.97%
1 Jan 1987 Jahr
9.103
+0.582
6.83%
1 Jan 1988 Jahr
9.803
+0.7
7.69%
1 Jan 1989 Jahr
10.639
+0.836
8.53%
1 Jan 1990 Jahr
11.439
+0.8
7.52%
1 Jan 1991 Jahr
12.241
+0.801
7.01%
1 Jan 1992 Jahr
13.139
+0.898
7.34%
1 Jan 1993 Jahr
13.82
+0.681
5.18%
1 Jan 1994 Jahr
14.66
+0.839
6.07%
1 Jan 1995 Jahr
15.336
+0.677
4.62%
1 Jan 1996 Jahr
16.083
+0.746
4.86%
1 Jan 1997 Jahr
17.098
+1.015
6.31%
1 Jan 1998 Jahr
18.352
+1.254
7.34%
1 Jan 1999 Jahr
19.388
+1.037
5.65%
1 Jan 2000 Jahr
20.577
+1.189
6.13%
1 Jan 2001 Jahr
21.431
+0.853
4.15%
1 Jan 2002 Jahr
22.201
+0.77
3.59%
1 Jan 2003 Jahr
23.033
+0.832
3.75%
1 Jan 2004 Jahr
23.475
+0.442
1.92%
1 Jan 2005 Jahr
24.592
+1.118
4.76%
1 Jan 2006 Jahr
24.654
+0.062
0.25%
1 Jan 2007 Jahr
25.956
+1.302
5.28%
1 Jan 2008 Jahr
25.893
-0.063
-0.24%
1 Jan 2009 Jahr
25.742
-0.15
-0.58%
1 Jan 2010 Jahr
25.338
-0.404
-1.57%
1 Jan 2011 Jahr
25.041
-0.297
-1.17%
1 Jan 2012 Jahr
24.624
-0.417
-1.67%
1 Jan 2013 Jahr
23.482
-1.143
-4.64%
1 Jan 2014 Jahr
22.766
-0.715
-3.05%
1 Jan 2015 Jahr
21.612
-1.154
-5.07%
1 Jan 2016 Jahr
20.276
-1.336
-6.18%
Bewertung der Länder gemäß mit laufender Statistik nach Jahren


Kommentare: