29
/de/
de
AIzaSyAYiBZKx7MnpbEhh9jyipgxe19OcubqV5w
April 1, 2024
240429
Singapore
SGP
true
2
1
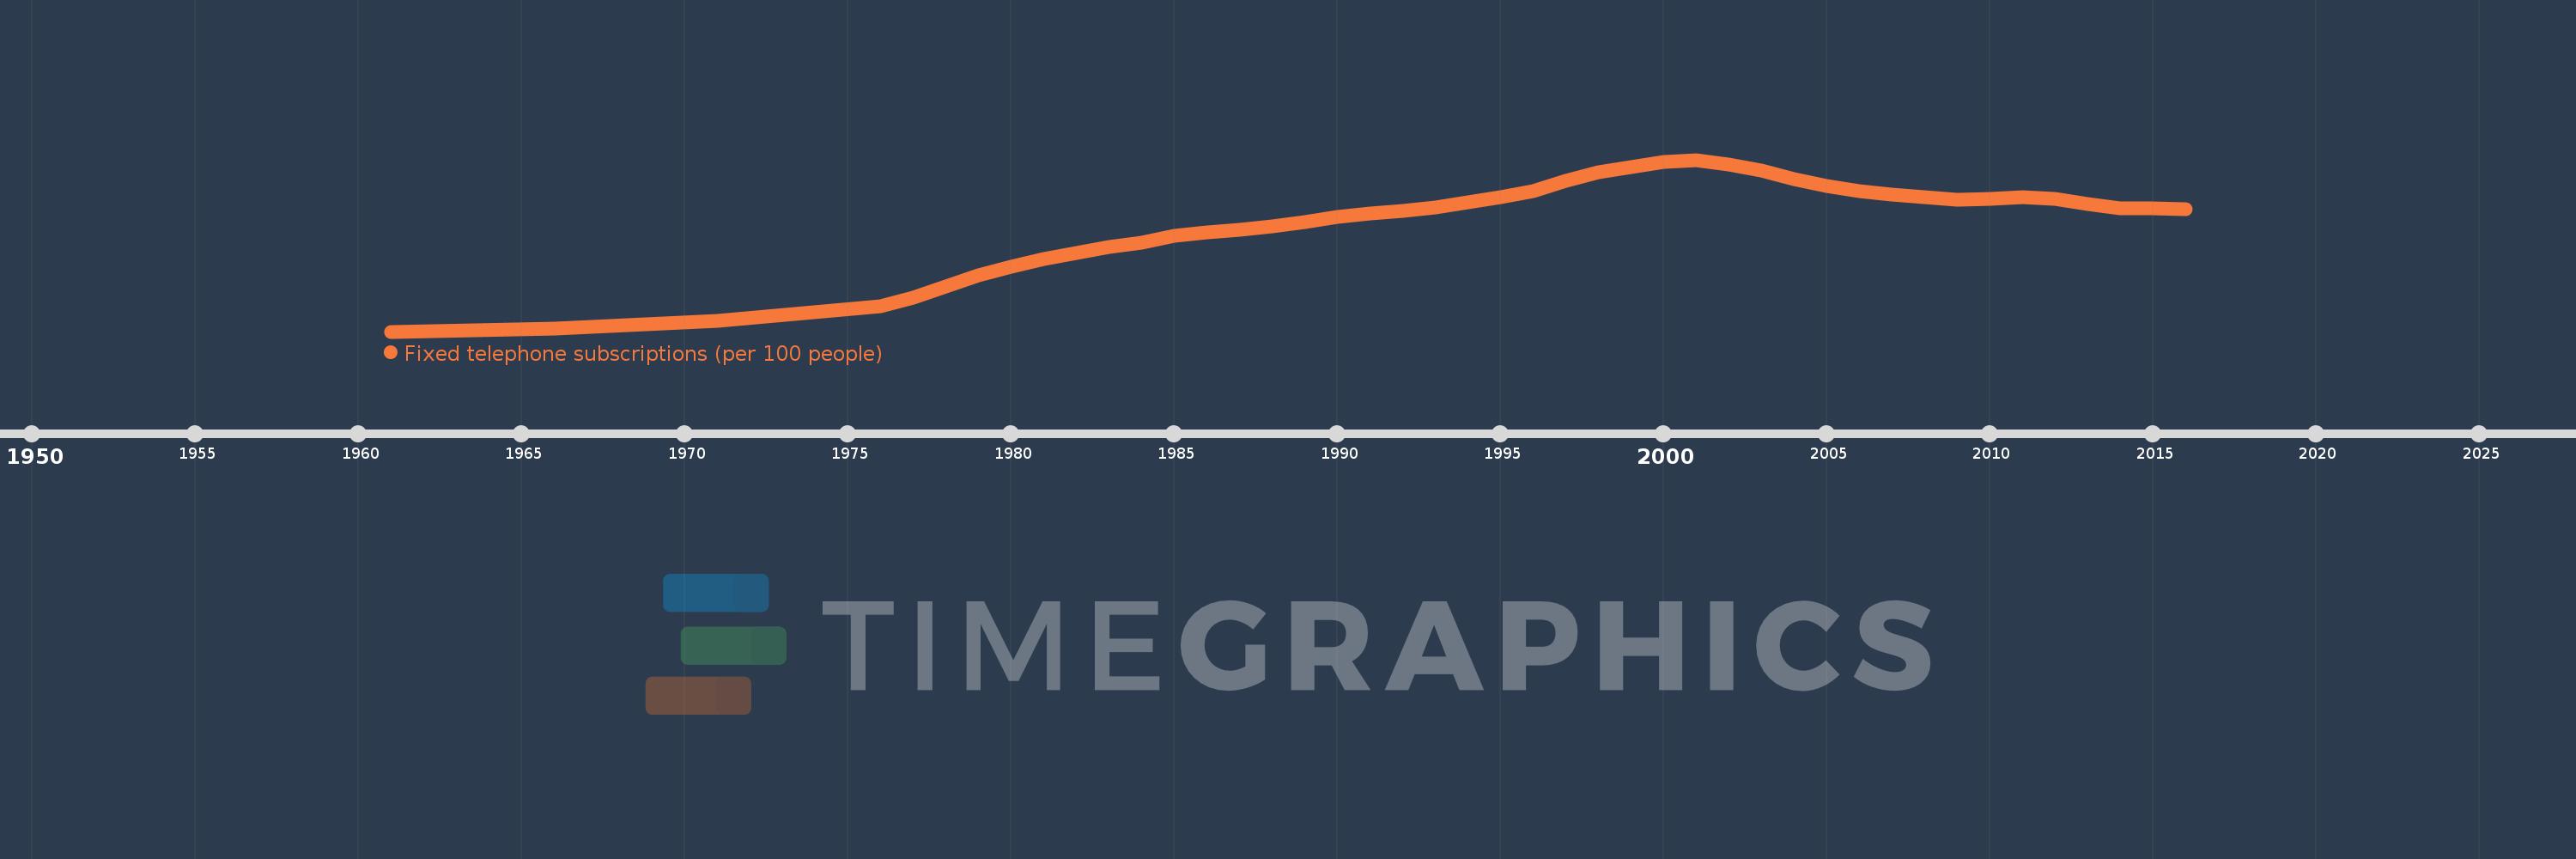
Fixed telephone subscriptions (per 100 people)
2016,2015,2014,2013,2012,2011,2010,2009,2008,2007,2006,2005,2004,2003,2002,2001,2000,1999,1998,1997,1996,1995,1994,1993,1992,1991,1990,1989,1988,1987,1986,1985,1984,1983,1982,1981,1980,1979,1978,1977,1976,1971,1966,1961
Diese Statistik in anderen Ländern:
AfghanistanAlbaniaAlgeriaAmerican SamoaAndorraAngolaAntigua and BarbudaArab WorldArgentinaArmeniaArubaAustraliaAustriaAzerbaijanBahamas, TheBahrainBangladeshBarbadosBelarusBelgiumBelizeBeninBermudaBhutanBoliviaBosnia and HerzegovinaBotswanaBrazilBritish Virgin IslandsBrunei DarussalamBulgariaBurkina FasoBurundiCabo VerdeCambodiaCameroonCanadaCaribbean small statesCayman IslandsCentral African RepublicCentral Europe and the BalticsChadChileChinaColombiaComorosCongo, Dem. Rep.Congo, Rep.Costa RicaCote d'IvoireCroatiaCubaCuracaoCyprusCzech RepublicDenmarkDjiboutiDominicaDominican RepublicEarly-demographic dividendEast Asia & PacificEast Asia & Pacific (excluding high income)East Asia & Pacific (IDA & IBRD countries)EcuadorEgypt, Arab Rep.El SalvadorEquatorial GuineaEritreaEstoniaEthiopiaEuro areaEurope & Central AsiaEurope & Central Asia (excluding high income)Europe & Central Asia (IDA & IBRD countries)European UnionFaroe IslandsFijiFinlandFragile and conflict affected situationsFranceFrench PolynesiaGabonGambia, TheGeorgiaGermanyGhanaGibraltarGreeceGreenlandGrenadaGuamGuatemalaGuineaGuinea-BissauGuyanaHaitiHeavily indebted poor countries (HIPC)High incomeHondurasHong Kong SAR, ChinaHungaryIBRD onlyIcelandIDA & IBRD totalIDA blendIDA onlyIDA totalIndiaIndonesiaIran, Islamic Rep.IraqIrelandIsraelItalyJamaicaJapanJordanKazakhstanKenyaKiribatiKorea, Dem. People’s Rep.Korea, Rep.KosovoKuwaitKyrgyz RepublicLao PDRLate-demographic dividendLatin America & Caribbean Latin America & Caribbean (excluding high income)Latin America & the Caribbean (IDA & IBRD countries)LatviaLeast developed countries: UN classificationLebanonLesothoLiberiaLibyaLiechtensteinLithuaniaLow & middle incomeLow incomeLower middle incomeLuxembourgMacao SAR, ChinaMacedonia, FYRMadagascarMalawiMalaysiaMaldivesMaliMaltaMarshall IslandsMauritaniaMauritiusMexicoMicronesia, Fed. Sts.Middle East & North AfricaMiddle East & North Africa (excluding high income)Middle East & North Africa (IDA & IBRD countries)Middle incomeMoldovaMonacoMongoliaMontenegroMoroccoMozambiqueMyanmarNamibiaNauruNepalNetherlandsNew CaledoniaNew ZealandNicaraguaNigerNigeriaNorth AmericaNorthern Mariana IslandsNorwayOECD membersOmanOther small statesPacific island small statesPakistanPalauPanamaPapua New GuineaParaguayPeruPhilippinesPolandPortugalPost-demographic dividendPre-demographic dividendPuerto RicoQatarRomaniaRussian FederationRwandaSamoaSan MarinoSao Tome and PrincipeSaudi ArabiaSenegalSerbiaSeychellesSierra LeoneSingaporeSlovak RepublicSloveniaSmall statesSolomon IslandsSomaliaSouth AfricaSouth AsiaSouth Asia (IDA & IBRD)South SudanSpainSri LankaSt. Kitts and NevisSt. LuciaSt. Vincent and the GrenadinesSub-Saharan Africa Sub-Saharan Africa (excluding high income)Sub-Saharan Africa (IDA & IBRD countries)SudanSurinameSwazilandSwedenSwitzerlandSyrian Arab RepublicTajikistanTanzaniaThailandTimor-LesteTogoTongaTrinidad and TobagoTunisiaTurkeyTurkmenistanTurks and Caicos IslandsTuvaluUgandaUkraineUnited Arab EmiratesUnited KingdomUnited StatesUpper middle incomeUruguayUzbekistanVanuatuVenezuela, RBVietnamVirgin Islands (U.S.)West Bank and GazaWorldYemen, Rep.ZambiaZimbabwe Zeitlinie:
Diese Zeitleiste vorliegt die Graphik ab 1961 J. bis 2016 J. Singapore. Die Angaben bis 1960 J. sind nicht vorhanden. Die Zahl aktueller Beobachtungen nach Daten: 44.
Die Quelle (Bezeichnung):
Kennzahlen der Weltentwicklung
Die Quelle (Einrichtung):
International Telecommunication Union, World Telecommunication/ICT Development Report and database.
Kategorien:
Infrastructure
Es wurde aktualisiert:
23 Apr 2017 Jahr
Kennzahlen der Wertänderungen vom Jahr zum Jahr
Minimum:
2.272
1 Jan 1961 Jahr
Maximum:
49.666
1 Jan 2001 Jahr
Zum Datum der Beobachtung
Wert
Absolute Veränderung
Die Veränderung bezüglich dem vorherigen Wert
1 Jan 1961 Jahr
2.272
+2.272
0.0%
1 Jan 1966 Jahr
3.106
+0.834
36.72%
1 Jan 1971 Jahr
5.132
+2.026
65.24%
1 Jan 1976 Jahr
9.299
+4.167
81.2%
1 Jan 1977 Jahr
11.663
+2.363
25.41%
1 Jan 1978 Jahr
14.665
+3.002
25.74%
1 Jan 1979 Jahr
17.72
+3.055
20.84%
1 Jan 1980 Jahr
20.207
+2.487
14.04%
1 Jan 1981 Jahr
22.224
+2.017
9.98%
1 Jan 1982 Jahr
23.936
+1.712
7.7%
1 Jan 1983 Jahr
25.511
+1.576
6.58%
1 Jan 1984 Jahr
26.849
+1.338
5.24%
1 Jan 1985 Jahr
28.699
+1.85
6.89%
1 Jan 1986 Jahr
29.724
+1.025
3.57%
1 Jan 1987 Jahr
30.41
+0.686
2.31%
1 Jan 1988 Jahr
31.391
+0.981
3.22%
1 Jan 1989 Jahr
32.592
+1.202
3.83%
1 Jan 1990 Jahr
33.906
+1.314
4.03%
1 Jan 1991 Jahr
34.94
+1.034
3.05%
1 Jan 1992 Jahr
35.518
+0.577
1.65%
1 Jan 1993 Jahr
36.614
+1.096
3.09%
1 Jan 1994 Jahr
37.845
+1.231
3.36%
1 Jan 1995 Jahr
39.294
+1.45
3.83%
1 Jan 1996 Jahr
41.021
+1.727
4.39%
1 Jan 1997 Jahr
43.772
+2.751
6.71%
1 Jan 1998 Jahr
46.123
+2.352
5.37%
1 Jan 1999 Jahr
47.594
+1.471
3.19%
1 Jan 2000 Jahr
49.092
+1.498
3.15%
1 Jan 2001 Jahr
49.666
+0.574
1.17%
1 Jan 2002 Jahr
48.406
-1.26
-2.54%
1 Jan 2003 Jahr
46.593
-1.813
-3.74%
1 Jan 2004 Jahr
44.409
-2.184
-4.69%
1 Jan 2005 Jahr
42.442
-1.967
-4.43%
1 Jan 2006 Jahr
41.027
-1.414
-3.33%
1 Jan 2007 Jahr
40.169
-0.859
-2.09%
1 Jan 2008 Jahr
39.344
-0.824
-2.05%
1 Jan 2009 Jahr
38.691
-0.653
-1.66%
1 Jan 2010 Jahr
38.896
+0.205
0.53%
1 Jan 2011 Jahr
39.301
+0.406
1.04%
1 Jan 2012 Jahr
38.868
-0.433
-1.1%
1 Jan 2013 Jahr
37.479
-1.389
-3.57%
1 Jan 2014 Jahr
36.347
-1.132
-3.02%
1 Jan 2015 Jahr
36.191
-0.156
-0.43%
1 Jan 2016 Jahr
35.977
-0.214
-0.59%
Bewertung der Länder gemäß mit laufender Statistik nach Jahren


Kommentare: