29
/de/
de
AIzaSyAYiBZKx7MnpbEhh9jyipgxe19OcubqV5w
April 1, 2024
172819
Kyrgyz Republic
KGZ
true
2
1
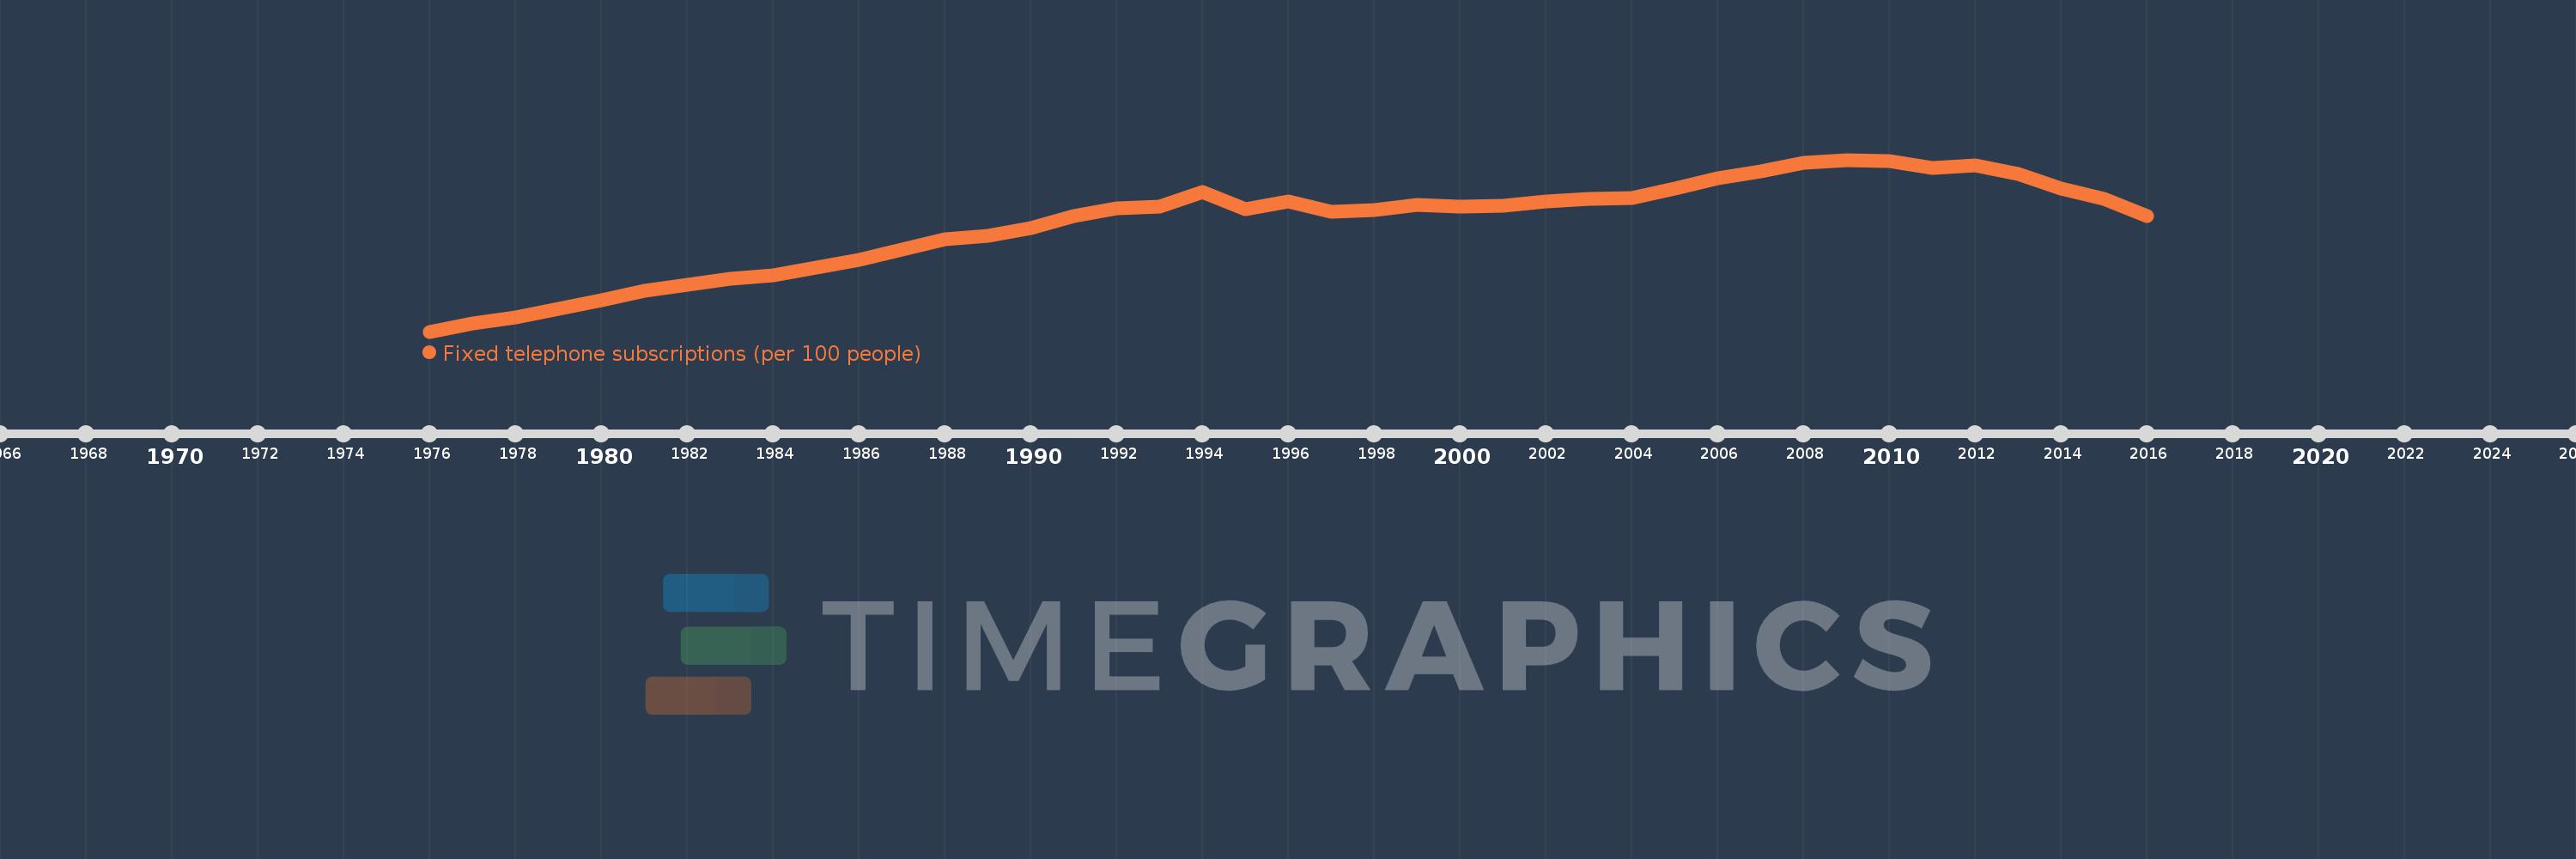
Fixed telephone subscriptions (per 100 people)
2016,2015,2014,2013,2012,2011,2010,2009,2008,2007,2006,2005,2004,2003,2002,2001,2000,1999,1998,1997,1996,1995,1994,1993,1992,1991,1990,1989,1988,1987,1986,1985,1984,1983,1982,1981,1980,1979,1978,1977,1976
Diese Statistik in anderen Ländern:
AfghanistanAlbaniaAlgeriaAmerican SamoaAndorraAngolaAntigua and BarbudaArab WorldArgentinaArmeniaArubaAustraliaAustriaAzerbaijanBahamas, TheBahrainBangladeshBarbadosBelarusBelgiumBelizeBeninBermudaBhutanBoliviaBosnia and HerzegovinaBotswanaBrazilBritish Virgin IslandsBrunei DarussalamBulgariaBurkina FasoBurundiCabo VerdeCambodiaCameroonCanadaCaribbean small statesCayman IslandsCentral African RepublicCentral Europe and the BalticsChadChileChinaColombiaComorosCongo, Dem. Rep.Congo, Rep.Costa RicaCote d'IvoireCroatiaCubaCuracaoCyprusCzech RepublicDenmarkDjiboutiDominicaDominican RepublicEarly-demographic dividendEast Asia & PacificEast Asia & Pacific (excluding high income)East Asia & Pacific (IDA & IBRD countries)EcuadorEgypt, Arab Rep.El SalvadorEquatorial GuineaEritreaEstoniaEthiopiaEuro areaEurope & Central AsiaEurope & Central Asia (excluding high income)Europe & Central Asia (IDA & IBRD countries)European UnionFaroe IslandsFijiFinlandFragile and conflict affected situationsFranceFrench PolynesiaGabonGambia, TheGeorgiaGermanyGhanaGibraltarGreeceGreenlandGrenadaGuamGuatemalaGuineaGuinea-BissauGuyanaHaitiHeavily indebted poor countries (HIPC)High incomeHondurasHong Kong SAR, ChinaHungaryIBRD onlyIcelandIDA & IBRD totalIDA blendIDA onlyIDA totalIndiaIndonesiaIran, Islamic Rep.IraqIrelandIsraelItalyJamaicaJapanJordanKazakhstanKenyaKiribatiKorea, Dem. People’s Rep.Korea, Rep.KosovoKuwaitKyrgyz RepublicLao PDRLate-demographic dividendLatin America & Caribbean Latin America & Caribbean (excluding high income)Latin America & the Caribbean (IDA & IBRD countries)LatviaLeast developed countries: UN classificationLebanonLesothoLiberiaLibyaLiechtensteinLithuaniaLow & middle incomeLow incomeLower middle incomeLuxembourgMacao SAR, ChinaMacedonia, FYRMadagascarMalawiMalaysiaMaldivesMaliMaltaMarshall IslandsMauritaniaMauritiusMexicoMicronesia, Fed. Sts.Middle East & North AfricaMiddle East & North Africa (excluding high income)Middle East & North Africa (IDA & IBRD countries)Middle incomeMoldovaMonacoMongoliaMontenegroMoroccoMozambiqueMyanmarNamibiaNauruNepalNetherlandsNew CaledoniaNew ZealandNicaraguaNigerNigeriaNorth AmericaNorthern Mariana IslandsNorwayOECD membersOmanOther small statesPacific island small statesPakistanPalauPanamaPapua New GuineaParaguayPeruPhilippinesPolandPortugalPost-demographic dividendPre-demographic dividendPuerto RicoQatarRomaniaRussian FederationRwandaSamoaSan MarinoSao Tome and PrincipeSaudi ArabiaSenegalSerbiaSeychellesSierra LeoneSingaporeSlovak RepublicSloveniaSmall statesSolomon IslandsSomaliaSouth AfricaSouth AsiaSouth Asia (IDA & IBRD)South SudanSpainSri LankaSt. Kitts and NevisSt. LuciaSt. Vincent and the GrenadinesSub-Saharan Africa Sub-Saharan Africa (excluding high income)Sub-Saharan Africa (IDA & IBRD countries)SudanSurinameSwazilandSwedenSwitzerlandSyrian Arab RepublicTajikistanTanzaniaThailandTimor-LesteTogoTongaTrinidad and TobagoTunisiaTurkeyTurkmenistanTurks and Caicos IslandsTuvaluUgandaUkraineUnited Arab EmiratesUnited KingdomUnited StatesUpper middle incomeUruguayUzbekistanVanuatuVenezuela, RBVietnamVirgin Islands (U.S.)West Bank and GazaWorldYemen, Rep.ZambiaZimbabwe Zeitlinie:
Diese Zeitleiste vorliegt die Graphik ab 1976 J. bis 2016 J. Kyrgyz Republic. Die Angaben bis 1975 J. sind nicht vorhanden. Die Zahl aktueller Beobachtungen nach Daten: 41.
Die Quelle (Bezeichnung):
Kennzahlen der Weltentwicklung
Die Quelle (Einrichtung):
International Telecommunication Union, World Telecommunication/ICT Development Report and database.
Kategorien:
Infrastructure
Es wurde aktualisiert:
23 Apr 2017 Jahr
Kennzahlen der Wertänderungen vom Jahr zum Jahr
Minimum:
2.335
1 Jan 1976 Jahr
Maximum:
9.515
1 Jan 2009 Jahr
Zum Datum der Beobachtung
Wert
Absolute Veränderung
Die Veränderung bezüglich dem vorherigen Wert
1 Jan 1976 Jahr
2.335
+2.335
0.0%
1 Jan 1977 Jahr
2.676
+0.341
14.59%
1 Jan 1978 Jahr
2.918
+0.242
9.05%
1 Jan 1979 Jahr
3.294
+0.376
12.88%
1 Jan 1980 Jahr
3.654
+0.36
10.93%
1 Jan 1981 Jahr
4.032
+0.378
10.35%
1 Jan 1982 Jahr
4.298
+0.266
6.6%
1 Jan 1983 Jahr
4.533
+0.235
5.47%
1 Jan 1984 Jahr
4.704
+0.171
3.77%
1 Jan 1985 Jahr
5.01
+0.306
6.51%
1 Jan 1986 Jahr
5.331
+0.32
6.39%
1 Jan 1987 Jahr
5.769
+0.439
8.23%
1 Jan 1988 Jahr
6.212
+0.442
7.67%
1 Jan 1989 Jahr
6.354
+0.142
2.29%
1 Jan 1990 Jahr
6.644
+0.291
4.57%
1 Jan 1991 Jahr
7.146
+0.502
7.56%
1 Jan 1992 Jahr
7.47
+0.323
4.52%
1 Jan 1993 Jahr
7.566
+0.097
1.29%
1 Jan 1994 Jahr
8.153
+0.586
7.75%
1 Jan 1995 Jahr
7.46
-0.692
-8.49%
1 Jan 1996 Jahr
7.774
+0.314
4.21%
1 Jan 1997 Jahr
7.341
-0.433
-5.57%
1 Jan 1998 Jahr
7.404
+0.063
0.85%
1 Jan 1999 Jahr
7.638
+0.234
3.15%
1 Jan 2000 Jahr
7.566
-0.072
-0.94%
1 Jan 2001 Jahr
7.59
+0.025
0.33%
1 Jan 2002 Jahr
7.783
+0.192
2.54%
1 Jan 2003 Jahr
7.89
+0.107
1.38%
1 Jan 2004 Jahr
7.908
+0.018
0.23%
1 Jan 2005 Jahr
8.297
+0.388
4.91%
1 Jan 2006 Jahr
8.734
+0.437
5.27%
1 Jan 2007 Jahr
9.03
+0.296
3.39%
1 Jan 2008 Jahr
9.388
+0.358
3.96%
1 Jan 2009 Jahr
9.515
+0.127
1.35%
1 Jan 2010 Jahr
9.465
-0.05
-0.53%
1 Jan 2011 Jahr
9.168
-0.296
-3.13%
1 Jan 2012 Jahr
9.291
+0.123
1.34%
1 Jan 2013 Jahr
8.93
-0.361
-3.88%
1 Jan 2014 Jahr
8.315
-0.615
-6.89%
1 Jan 2015 Jahr
7.879
-0.436
-5.25%
1 Jan 2016 Jahr
7.149
-0.73
-9.26%
Bewertung der Länder gemäß mit laufender Statistik nach Jahren


Kommentare: