29
/de/
de
AIzaSyAYiBZKx7MnpbEhh9jyipgxe19OcubqV5w
April 1, 2024
29733
Euro area
EMU
false
2
1
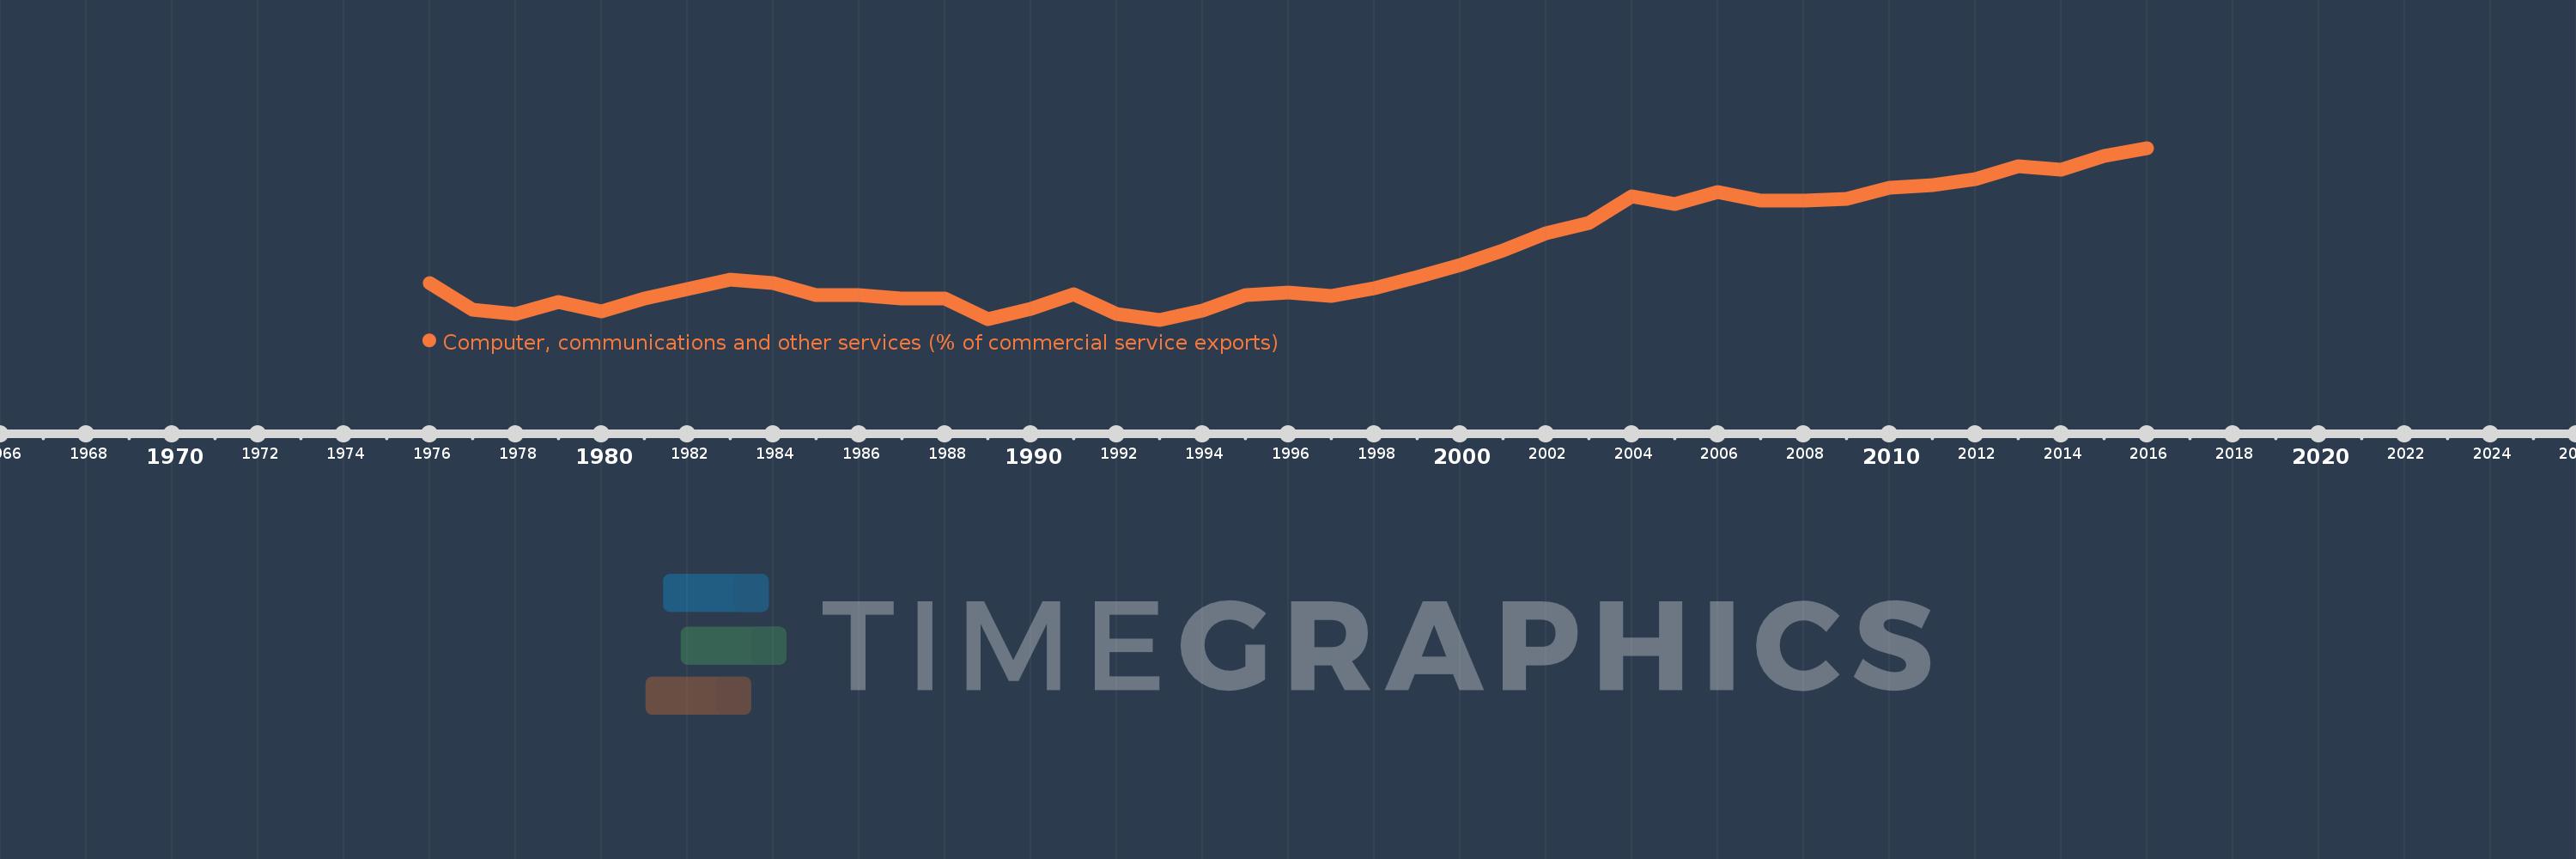
Computer, communications and other services (% of commercial service exports)
2016,2015,2014,2013,2012,2011,2010,2009,2008,2007,2006,2005,2004,2003,2002,2001,2000,1999,1998,1997,1996,1995,1994,1993,1992,1991,1990,1989,1988,1987,1986,1985,1984,1983,1982,1981,1980,1979,1978,1977,1976
Diese Statistik in anderen Ländern:
AfghanistanAlbaniaAlgeriaAngolaAntigua and BarbudaArab WorldArgentinaArmeniaArubaAustraliaAustriaAzerbaijanBahamas, TheBahrainBangladeshBarbadosBelarusBelgiumBelizeBeninBermudaBhutanBoliviaBosnia and HerzegovinaBotswanaBrazilBrunei DarussalamBulgariaBurkina FasoBurundiCabo VerdeCambodiaCameroonCanadaCaribbean small statesCentral African RepublicCentral Europe and the BalticsChadChileChinaColombiaComorosCongo, Dem. Rep.Congo, Rep.Costa RicaCote d'IvoireCroatiaCuracaoCyprusCzech RepublicDenmarkDjiboutiDominicaDominican RepublicEarly-demographic dividendEast Asia & PacificEast Asia & Pacific (excluding high income)East Asia & Pacific (IDA & IBRD countries)EcuadorEgypt, Arab Rep.El SalvadorEritreaEstoniaEthiopiaEuro areaEurope & Central AsiaEurope & Central Asia (excluding high income)Europe & Central Asia (IDA & IBRD countries)European UnionFaroe IslandsFijiFinlandFragile and conflict affected situationsFranceFrench PolynesiaGabonGambia, TheGeorgiaGermanyGhanaGreeceGrenadaGuatemalaGuineaGuinea-BissauGuyanaHaitiHeavily indebted poor countries (HIPC)High incomeHondurasHong Kong SAR, ChinaHungaryIBRD onlyIcelandIDA & IBRD totalIDA onlyIDA totalIndiaIndonesiaIran, Islamic Rep.IraqIrelandIsraelItalyJamaicaJapanJordanKazakhstanKenyaKiribatiKorea, Rep.KosovoKuwaitKyrgyz RepublicLao PDRLate-demographic dividendLatin America & Caribbean Latin America & Caribbean (excluding high income)Latin America & the Caribbean (IDA & IBRD countries)LatviaLeast developed countries: UN classificationLebanonLesothoLiberiaLibyaLithuaniaLow & middle incomeLow incomeLower middle incomeLuxembourgMacao SAR, ChinaMacedonia, FYRMadagascarMalawiMalaysiaMaldivesMaliMaltaMarshall IslandsMauritaniaMauritiusMexicoMicronesia, Fed. Sts.Middle East & North AfricaMiddle East & North Africa (excluding high income)Middle East & North Africa (IDA & IBRD countries)Middle incomeMoldovaMongoliaMontenegroMoroccoMozambiqueMyanmarNamibiaNepalNetherlandsNew CaledoniaNew ZealandNicaraguaNigerNigeriaNorth AmericaNorwayOECD membersOmanOther small statesPacific island small statesPakistanPalauPanamaPapua New GuineaParaguayPeruPhilippinesPolandPortugalPost-demographic dividendPre-demographic dividendQatarRomaniaRussian FederationRwandaSamoaSao Tome and PrincipeSaudi ArabiaSenegalSerbiaSeychellesSierra LeoneSingaporeSint Maarten (Dutch part)Slovak RepublicSloveniaSmall statesSolomon IslandsSouth AfricaSouth AsiaSouth Asia (IDA & IBRD)South SudanSpainSri LankaSt. Kitts and NevisSt. LuciaSt. Vincent and the GrenadinesSub-Saharan Africa Sub-Saharan Africa (excluding high income)Sub-Saharan Africa (IDA & IBRD countries)SudanSurinameSwazilandSwedenSwitzerlandSyrian Arab RepublicTajikistanTanzaniaThailandTimor-LesteTogoTongaTrinidad and TobagoTunisiaTurkeyTuvaluUgandaUkraineUnited KingdomUnited StatesUpper middle incomeUruguayVanuatuVenezuela, RBWest Bank and GazaWorldYemen, Rep.ZambiaZimbabwe Zeitlinie:
Diese Zeitleiste vorliegt die Graphik ab 1976 J. bis 2016 J. Euro area. Die Angaben bis 1975 J. sind nicht vorhanden. Die Zahl aktueller Beobachtungen nach Daten: 41.
Die Quelle (Bezeichnung):
Kennzahlen der Weltentwicklung
Die Quelle (Einrichtung):
International Monetary Fund, Balance of Payments Statistics Yearbook and data files.
Kategorien:
Private Sector, Trade
Es wurde aktualisiert:
23 Apr 2017 Jahr
Kennzahlen der Wertänderungen vom Jahr zum Jahr
Minimum:
32.165
1 Jan 1993 Jahr
Maximum:
52.373
1 Jan 2016 Jahr
Zum Datum der Beobachtung
Wert
Absolute Veränderung
Die Veränderung bezüglich dem vorherigen Wert
1 Jan 1976 Jahr
36.512
+36.512
0.0%
1 Jan 1977 Jahr
33.334
-3.178
-8.71%
1 Jan 1978 Jahr
32.885
-0.448
-1.34%
1 Jan 1979 Jahr
34.284
+1.399
4.25%
1 Jan 1980 Jahr
33.158
-1.126
-3.29%
1 Jan 1981 Jahr
34.638
+1.48
4.46%
1 Jan 1982 Jahr
35.812
+1.174
3.39%
1 Jan 1983 Jahr
36.866
+1.055
2.94%
1 Jan 1984 Jahr
36.483
-0.383
-1.04%
1 Jan 1985 Jahr
35.072
-1.412
-3.87%
1 Jan 1986 Jahr
35.025
-0.046
-0.13%
1 Jan 1987 Jahr
34.67
-0.356
-1.02%
1 Jan 1988 Jahr
34.622
-0.047
-0.14%
1 Jan 1989 Jahr
32.218
-2.404
-6.94%
1 Jan 1990 Jahr
33.469
+1.251
3.88%
1 Jan 1991 Jahr
35.123
+1.654
4.94%
1 Jan 1992 Jahr
32.826
-2.297
-6.54%
1 Jan 1993 Jahr
32.165
-0.661
-2.01%
1 Jan 1994 Jahr
33.235
+1.07
3.33%
1 Jan 1995 Jahr
35.058
+1.824
5.49%
1 Jan 1996 Jahr
35.34
+0.282
0.8%
1 Jan 1997 Jahr
34.917
-0.424
-1.2%
1 Jan 1998 Jahr
35.827
+0.91
2.61%
1 Jan 1999 Jahr
37.203
+1.375
3.84%
1 Jan 2000 Jahr
38.579
+1.377
3.7%
1 Jan 2001 Jahr
40.31
+1.731
4.49%
1 Jan 2002 Jahr
42.328
+2.018
5.01%
1 Jan 2003 Jahr
43.535
+1.206
2.85%
1 Jan 2004 Jahr
46.717
+3.182
7.31%
1 Jan 2005 Jahr
45.798
-0.918
-1.97%
1 Jan 2006 Jahr
47.209
+1.411
3.08%
1 Jan 2007 Jahr
46.191
-1.018
-2.16%
1 Jan 2008 Jahr
46.193
+0.001
0.0%
1 Jan 2009 Jahr
46.37
+0.177
0.38%
1 Jan 2010 Jahr
47.706
+1.336
2.88%
1 Jan 2011 Jahr
48.028
+0.322
0.68%
1 Jan 2012 Jahr
48.739
+0.711
1.48%
1 Jan 2013 Jahr
50.242
+1.503
3.08%
1 Jan 2014 Jahr
49.778
-0.465
-0.92%
1 Jan 2015 Jahr
51.383
+1.605
3.22%
1 Jan 2016 Jahr
52.373
+0.99
1.93%
Bewertung der Länder gemäß mit laufender Statistik nach Jahren


Kommentare: