29
/de/
de
AIzaSyAYiBZKx7MnpbEhh9jyipgxe19OcubqV5w
April 1, 2024
235517
Senegal
SEN
true
2
1
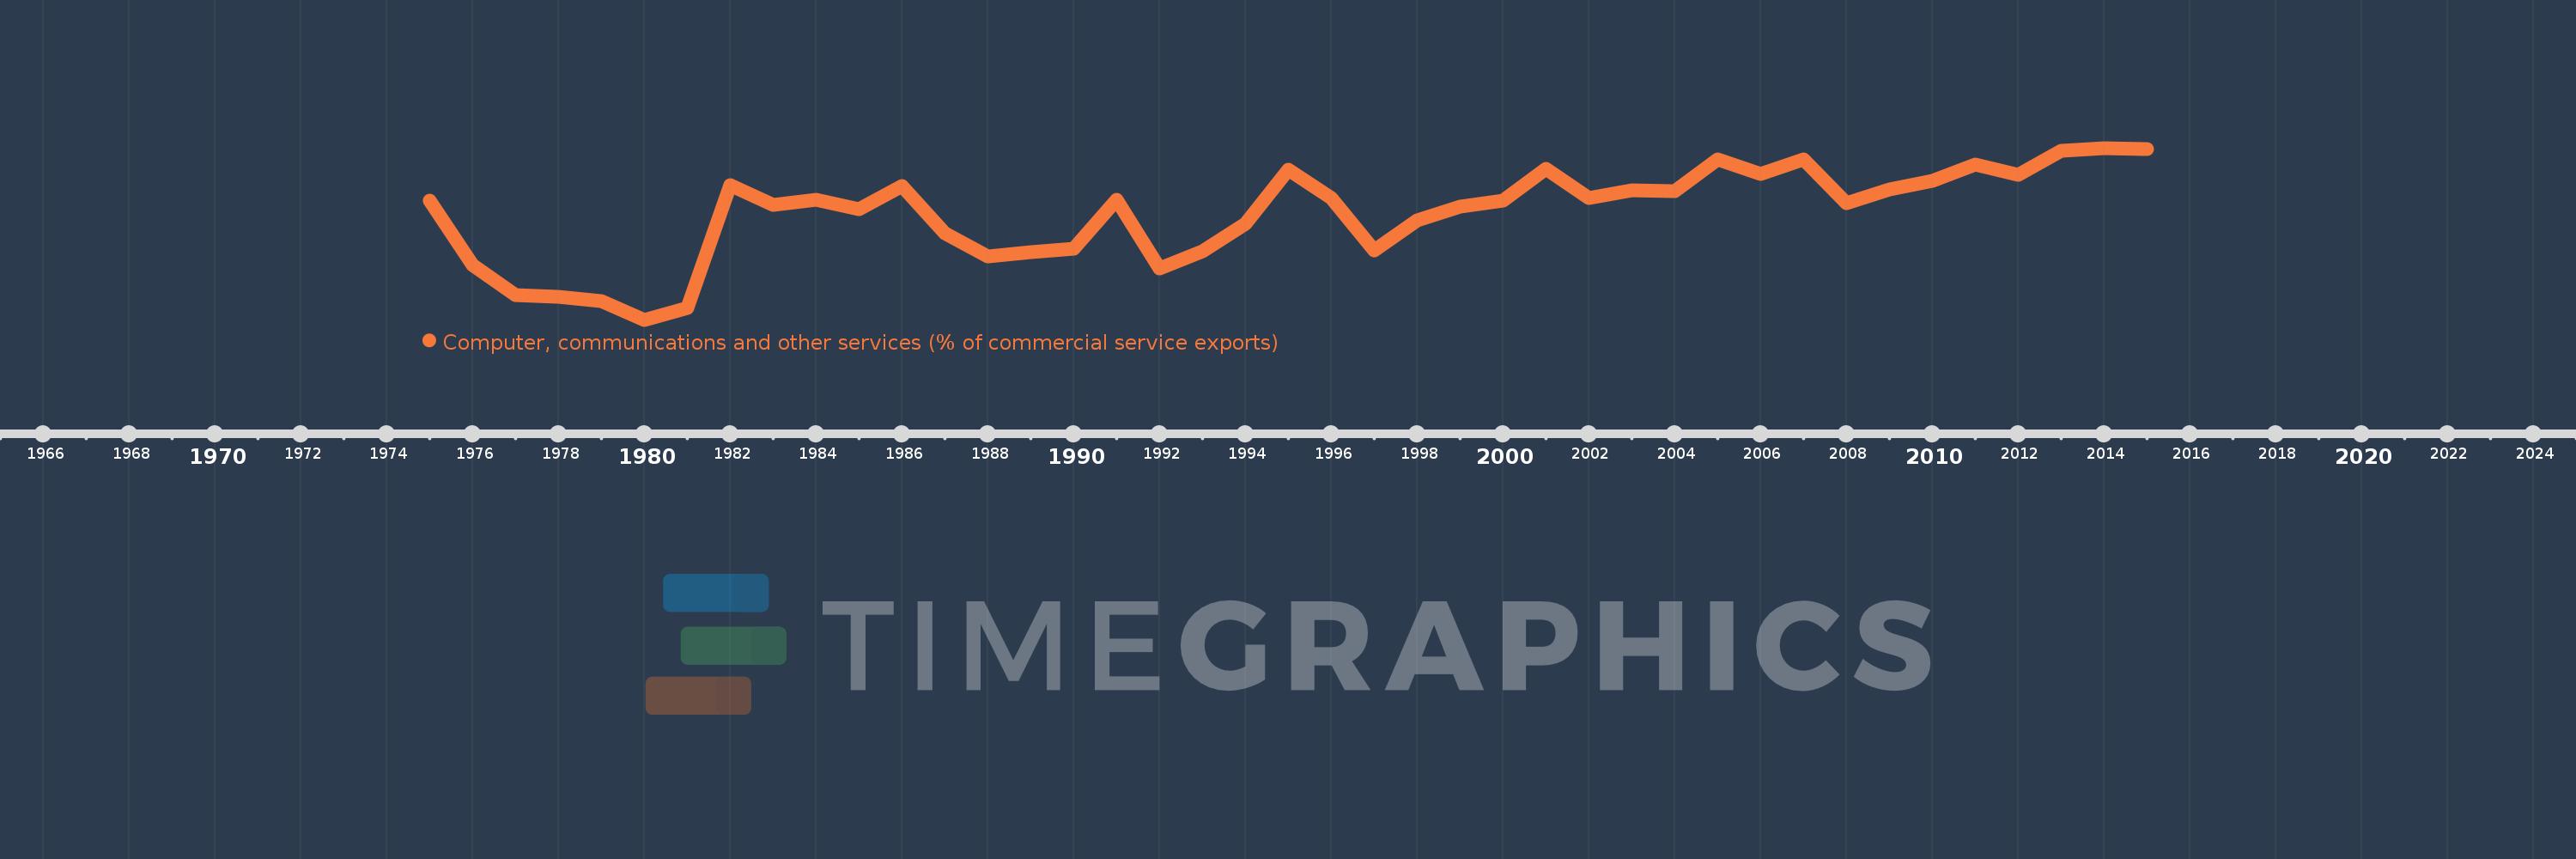
Computer, communications and other services (% of commercial service exports)
2015,2014,2013,2012,2011,2010,2009,2008,2007,2006,2005,2004,2003,2002,2001,2000,1999,1998,1997,1996,1995,1994,1993,1992,1991,1990,1989,1988,1987,1986,1985,1984,1983,1982,1981,1980,1979,1978,1977,1976,1975
Diese Statistik in anderen Ländern:
AfghanistanAlbaniaAlgeriaAngolaAntigua and BarbudaArab WorldArgentinaArmeniaArubaAustraliaAustriaAzerbaijanBahamas, TheBahrainBangladeshBarbadosBelarusBelgiumBelizeBeninBermudaBhutanBoliviaBosnia and HerzegovinaBotswanaBrazilBrunei DarussalamBulgariaBurkina FasoBurundiCabo VerdeCambodiaCameroonCanadaCaribbean small statesCentral African RepublicCentral Europe and the BalticsChadChileChinaColombiaComorosCongo, Dem. Rep.Congo, Rep.Costa RicaCote d'IvoireCroatiaCuracaoCyprusCzech RepublicDenmarkDjiboutiDominicaDominican RepublicEarly-demographic dividendEast Asia & PacificEast Asia & Pacific (excluding high income)East Asia & Pacific (IDA & IBRD countries)EcuadorEgypt, Arab Rep.El SalvadorEritreaEstoniaEthiopiaEuro areaEurope & Central AsiaEurope & Central Asia (excluding high income)Europe & Central Asia (IDA & IBRD countries)European UnionFaroe IslandsFijiFinlandFragile and conflict affected situationsFranceFrench PolynesiaGabonGambia, TheGeorgiaGermanyGhanaGreeceGrenadaGuatemalaGuineaGuinea-BissauGuyanaHaitiHeavily indebted poor countries (HIPC)High incomeHondurasHong Kong SAR, ChinaHungaryIBRD onlyIcelandIDA & IBRD totalIDA onlyIDA totalIndiaIndonesiaIran, Islamic Rep.IraqIrelandIsraelItalyJamaicaJapanJordanKazakhstanKenyaKiribatiKorea, Rep.KosovoKuwaitKyrgyz RepublicLao PDRLate-demographic dividendLatin America & Caribbean Latin America & Caribbean (excluding high income)Latin America & the Caribbean (IDA & IBRD countries)LatviaLeast developed countries: UN classificationLebanonLesothoLiberiaLibyaLithuaniaLow & middle incomeLow incomeLower middle incomeLuxembourgMacao SAR, ChinaMacedonia, FYRMadagascarMalawiMalaysiaMaldivesMaliMaltaMarshall IslandsMauritaniaMauritiusMexicoMicronesia, Fed. Sts.Middle East & North AfricaMiddle East & North Africa (excluding high income)Middle East & North Africa (IDA & IBRD countries)Middle incomeMoldovaMongoliaMontenegroMoroccoMozambiqueMyanmarNamibiaNepalNetherlandsNew CaledoniaNew ZealandNicaraguaNigerNigeriaNorth AmericaNorwayOECD membersOmanOther small statesPacific island small statesPakistanPalauPanamaPapua New GuineaParaguayPeruPhilippinesPolandPortugalPost-demographic dividendPre-demographic dividendQatarRomaniaRussian FederationRwandaSamoaSao Tome and PrincipeSaudi ArabiaSenegalSerbiaSeychellesSierra LeoneSingaporeSint Maarten (Dutch part)Slovak RepublicSloveniaSmall statesSolomon IslandsSouth AfricaSouth AsiaSouth Asia (IDA & IBRD)South SudanSpainSri LankaSt. Kitts and NevisSt. LuciaSt. Vincent and the GrenadinesSub-Saharan Africa Sub-Saharan Africa (excluding high income)Sub-Saharan Africa (IDA & IBRD countries)SudanSurinameSwazilandSwedenSwitzerlandSyrian Arab RepublicTajikistanTanzaniaThailandTimor-LesteTogoTongaTrinidad and TobagoTunisiaTurkeyTuvaluUgandaUkraineUnited KingdomUnited StatesUpper middle incomeUruguayVanuatuVenezuela, RBWest Bank and GazaWorldYemen, Rep.ZambiaZimbabwe Zeitlinie:
Diese Zeitleiste vorliegt die Graphik ab 1975 J. bis 2015 J. Senegal. Die Angaben bis 1974 J. sind nicht vorhanden. Die Zahl aktueller Beobachtungen nach Daten: 41.
Die Quelle (Bezeichnung):
Kennzahlen der Weltentwicklung
Die Quelle (Einrichtung):
International Monetary Fund, Balance of Payments Statistics Yearbook and data files.
Kategorien:
Private Sector, Trade
Es wurde aktualisiert:
23 Apr 2017 Jahr
Kennzahlen der Wertänderungen vom Jahr zum Jahr
Minimum:
11.784
1 Jan 1980 Jahr
Maximum:
48.706
1 Jan 2014 Jahr
Zum Datum der Beobachtung
Wert
Absolute Veränderung
Die Veränderung bezüglich dem vorherigen Wert
1 Jan 1975 Jahr
37.47
+37.47
0.0%
1 Jan 1976 Jahr
23.554
-13.917
-37.14%
1 Jan 1977 Jahr
17.153
-6.401
-27.17%
1 Jan 1978 Jahr
16.693
-0.46
-2.68%
1 Jan 1979 Jahr
15.769
-0.925
-5.54%
1 Jan 1980 Jahr
11.784
-3.985
-25.27%
1 Jan 1981 Jahr
14.314
+2.53
21.47%
1 Jan 1982 Jahr
40.698
+26.384
184.32%
1 Jan 1983 Jahr
36.376
-4.322
-10.62%
1 Jan 1984 Jahr
37.61
+1.234
3.39%
1 Jan 1985 Jahr
35.474
-2.136
-5.68%
1 Jan 1986 Jahr
40.462
+4.988
14.06%
1 Jan 1987 Jahr
30.395
-10.067
-24.88%
1 Jan 1988 Jahr
25.305
-5.091
-16.75%
1 Jan 1989 Jahr
26.402
+1.097
4.34%
1 Jan 1990 Jahr
26.991
+0.589
2.23%
1 Jan 1991 Jahr
37.566
+10.574
39.18%
1 Jan 1992 Jahr
22.719
-14.847
-39.52%
1 Jan 1993 Jahr
26.487
+3.768
16.59%
1 Jan 1994 Jahr
32.428
+5.94
22.43%
1 Jan 1995 Jahr
44.034
+11.606
35.79%
1 Jan 1996 Jahr
37.87
-6.164
-14.0%
1 Jan 1997 Jahr
26.707
-11.163
-29.48%
1 Jan 1998 Jahr
33.159
+6.451
24.16%
1 Jan 1999 Jahr
36.039
+2.88
8.69%
1 Jan 2000 Jahr
37.358
+1.32
3.66%
1 Jan 2001 Jahr
44.311
+6.953
18.61%
1 Jan 2002 Jahr
37.921
-6.39
-14.42%
1 Jan 2003 Jahr
39.628
+1.707
4.5%
1 Jan 2004 Jahr
39.357
-0.271
-0.68%
1 Jan 2005 Jahr
46.182
+6.825
17.34%
1 Jan 2006 Jahr
43.125
-3.057
-6.62%
1 Jan 2007 Jahr
46.218
+3.093
7.17%
1 Jan 2008 Jahr
36.841
-9.378
-20.29%
1 Jan 2009 Jahr
39.794
+2.953
8.02%
1 Jan 2010 Jahr
41.668
+1.874
4.71%
1 Jan 2011 Jahr
45.183
+3.515
8.43%
1 Jan 2012 Jahr
42.942
-2.241
-4.96%
1 Jan 2013 Jahr
48.053
+5.112
11.9%
1 Jan 2014 Jahr
48.706
+0.652
1.36%
1 Jan 2015 Jahr
48.498
-0.207
-0.43%
Bewertung der Länder gemäß mit laufender Statistik nach Jahren


Kommentare: