29
/de/
de
AIzaSyAYiBZKx7MnpbEhh9jyipgxe19OcubqV5w
April 1, 2024
275519
United Kingdom
GBR
true
2
1
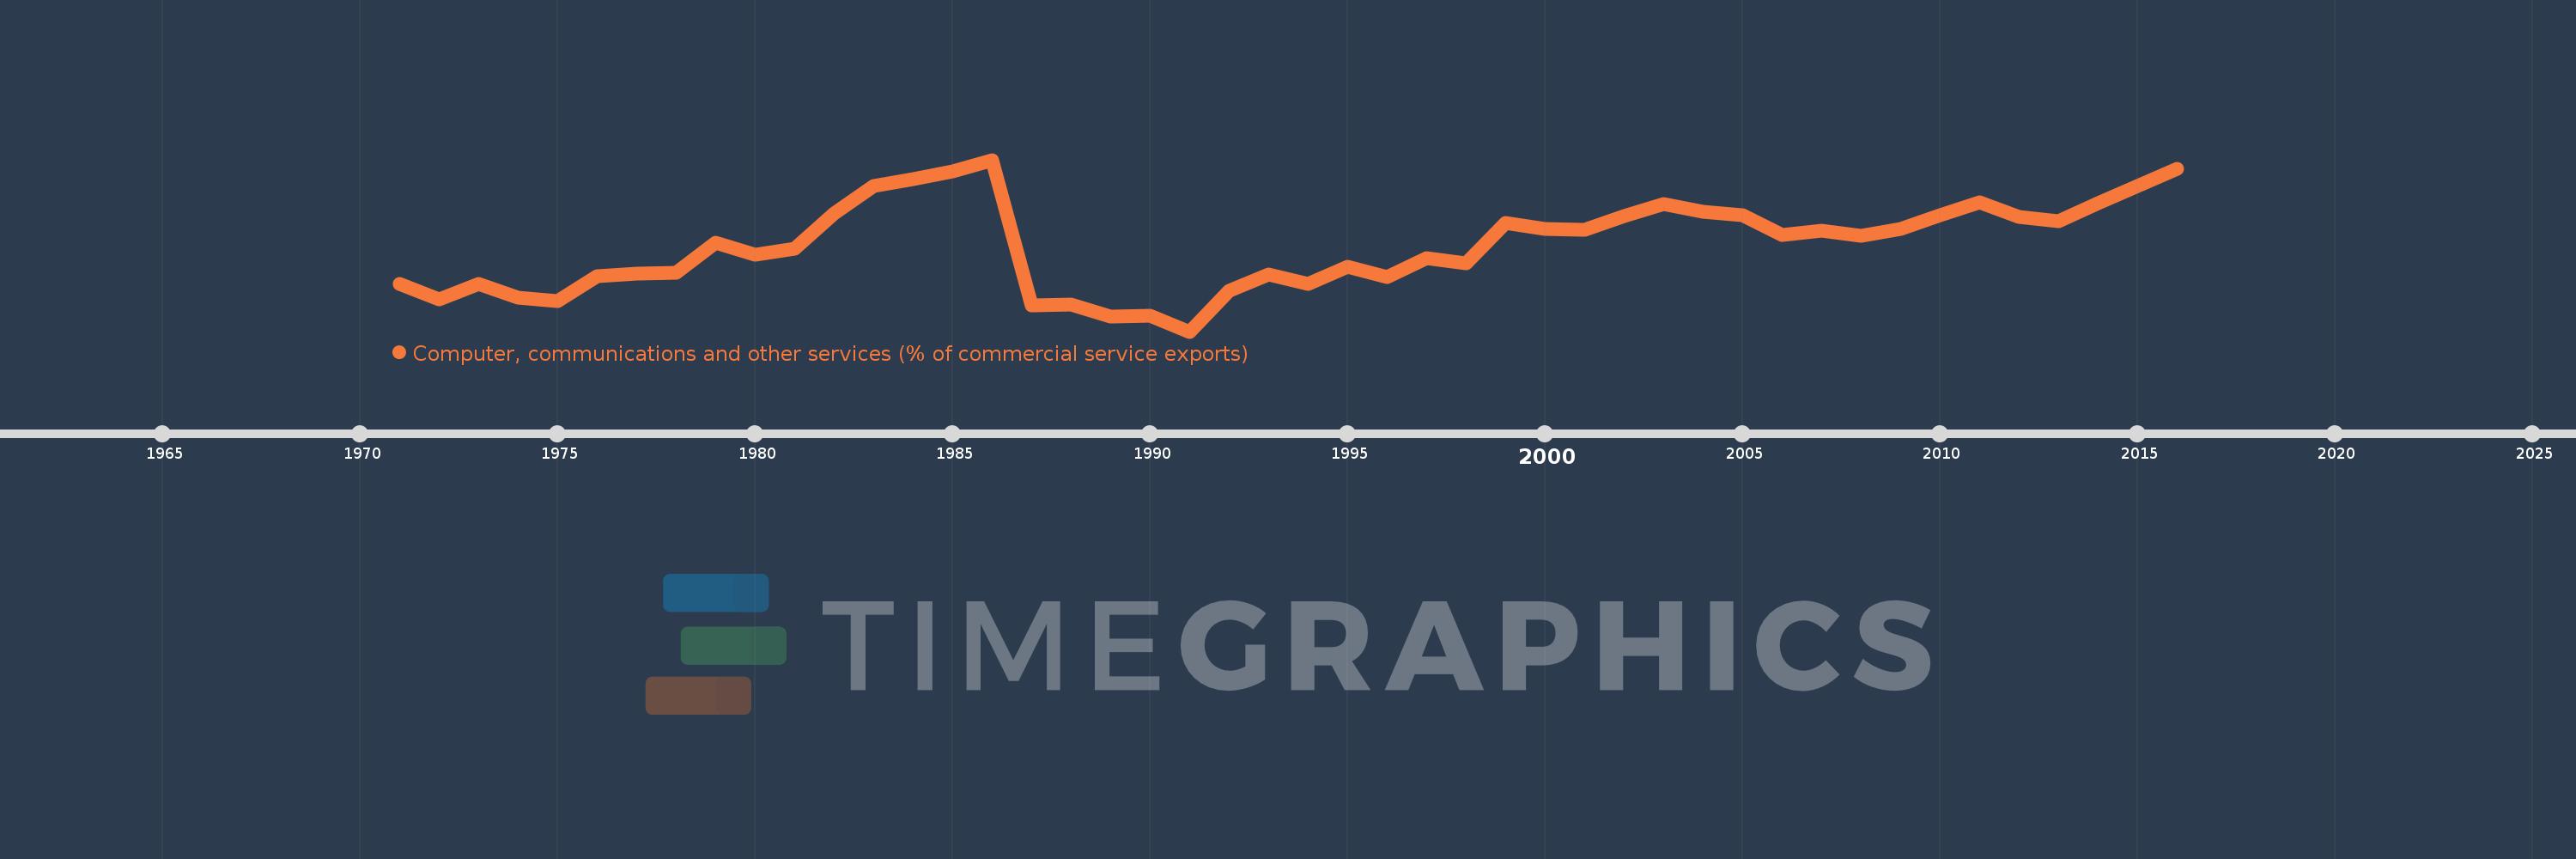
Computer, communications and other services (% of commercial service exports)
2016,2015,2014,2013,2012,2011,2010,2009,2008,2007,2006,2005,2004,2003,2002,2001,2000,1999,1998,1997,1996,1995,1994,1993,1992,1991,1990,1989,1988,1987,1986,1985,1984,1983,1982,1981,1980,1979,1978,1977,1976,1975,1974,1973,1972,1971
Diese Statistik in anderen Ländern:
AfghanistanAlbaniaAlgeriaAngolaAntigua and BarbudaArab WorldArgentinaArmeniaArubaAustraliaAustriaAzerbaijanBahamas, TheBahrainBangladeshBarbadosBelarusBelgiumBelizeBeninBermudaBhutanBoliviaBosnia and HerzegovinaBotswanaBrazilBrunei DarussalamBulgariaBurkina FasoBurundiCabo VerdeCambodiaCameroonCanadaCaribbean small statesCentral African RepublicCentral Europe and the BalticsChadChileChinaColombiaComorosCongo, Dem. Rep.Congo, Rep.Costa RicaCote d'IvoireCroatiaCuracaoCyprusCzech RepublicDenmarkDjiboutiDominicaDominican RepublicEarly-demographic dividendEast Asia & PacificEast Asia & Pacific (excluding high income)East Asia & Pacific (IDA & IBRD countries)EcuadorEgypt, Arab Rep.El SalvadorEritreaEstoniaEthiopiaEuro areaEurope & Central AsiaEurope & Central Asia (excluding high income)Europe & Central Asia (IDA & IBRD countries)European UnionFaroe IslandsFijiFinlandFragile and conflict affected situationsFranceFrench PolynesiaGabonGambia, TheGeorgiaGermanyGhanaGreeceGrenadaGuatemalaGuineaGuinea-BissauGuyanaHaitiHeavily indebted poor countries (HIPC)High incomeHondurasHong Kong SAR, ChinaHungaryIBRD onlyIcelandIDA & IBRD totalIDA onlyIDA totalIndiaIndonesiaIran, Islamic Rep.IraqIrelandIsraelItalyJamaicaJapanJordanKazakhstanKenyaKiribatiKorea, Rep.KosovoKuwaitKyrgyz RepublicLao PDRLate-demographic dividendLatin America & Caribbean Latin America & Caribbean (excluding high income)Latin America & the Caribbean (IDA & IBRD countries)LatviaLeast developed countries: UN classificationLebanonLesothoLiberiaLibyaLithuaniaLow & middle incomeLow incomeLower middle incomeLuxembourgMacao SAR, ChinaMacedonia, FYRMadagascarMalawiMalaysiaMaldivesMaliMaltaMarshall IslandsMauritaniaMauritiusMexicoMicronesia, Fed. Sts.Middle East & North AfricaMiddle East & North Africa (excluding high income)Middle East & North Africa (IDA & IBRD countries)Middle incomeMoldovaMongoliaMontenegroMoroccoMozambiqueMyanmarNamibiaNepalNetherlandsNew CaledoniaNew ZealandNicaraguaNigerNigeriaNorth AmericaNorwayOECD membersOmanOther small statesPacific island small statesPakistanPalauPanamaPapua New GuineaParaguayPeruPhilippinesPolandPortugalPost-demographic dividendPre-demographic dividendQatarRomaniaRussian FederationRwandaSamoaSao Tome and PrincipeSaudi ArabiaSenegalSerbiaSeychellesSierra LeoneSingaporeSint Maarten (Dutch part)Slovak RepublicSloveniaSmall statesSolomon IslandsSouth AfricaSouth AsiaSouth Asia (IDA & IBRD)South SudanSpainSri LankaSt. Kitts and NevisSt. LuciaSt. Vincent and the GrenadinesSub-Saharan Africa Sub-Saharan Africa (excluding high income)Sub-Saharan Africa (IDA & IBRD countries)SudanSurinameSwazilandSwedenSwitzerlandSyrian Arab RepublicTajikistanTanzaniaThailandTimor-LesteTogoTongaTrinidad and TobagoTunisiaTurkeyTuvaluUgandaUkraineUnited KingdomUnited StatesUpper middle incomeUruguayVanuatuVenezuela, RBWest Bank and GazaWorldYemen, Rep.ZambiaZimbabwe Zeitlinie:
Diese Zeitleiste vorliegt die Graphik ab 1971 J. bis 2016 J. United Kingdom. Die Angaben bis 1970 J. sind nicht vorhanden. Die Zahl aktueller Beobachtungen nach Daten: 46.
Die Quelle (Bezeichnung):
Kennzahlen der Weltentwicklung
Die Quelle (Einrichtung):
International Monetary Fund, Balance of Payments Statistics Yearbook and data files.
Kategorien:
Private Sector, Trade
Es wurde aktualisiert:
23 Apr 2017 Jahr
Kennzahlen der Wertänderungen vom Jahr zum Jahr
Minimum:
29.389
1 Jan 1991 Jahr
Maximum:
48.265
1 Jan 1986 Jahr
Zum Datum der Beobachtung
Wert
Absolute Veränderung
Die Veränderung bezüglich dem vorherigen Wert
1 Jan 1971 Jahr
34.603
+34.603
0.0%
1 Jan 1972 Jahr
32.941
-1.663
-4.8%
1 Jan 1973 Jahr
34.619
+1.678
5.1%
1 Jan 1974 Jahr
33.1
-1.519
-4.39%
1 Jan 1975 Jahr
32.708
-0.392
-1.18%
1 Jan 1976 Jahr
35.433
+2.725
8.33%
1 Jan 1977 Jahr
35.746
+0.313
0.88%
1 Jan 1978 Jahr
35.834
+0.087
0.24%
1 Jan 1979 Jahr
39.163
+3.33
9.29%
1 Jan 1980 Jahr
37.882
-1.281
-3.27%
1 Jan 1981 Jahr
38.511
+0.629
1.66%
1 Jan 1982 Jahr
42.376
+3.865
10.04%
1 Jan 1983 Jahr
45.423
+3.047
7.19%
1 Jan 1984 Jahr
46.168
+0.745
1.64%
1 Jan 1985 Jahr
46.964
+0.797
1.73%
1 Jan 1986 Jahr
48.265
+1.3
2.77%
1 Jan 1987 Jahr
32.284
-15.981
-33.11%
1 Jan 1988 Jahr
32.383
+0.1
0.31%
1 Jan 1989 Jahr
31.08
-1.303
-4.02%
1 Jan 1990 Jahr
31.158
+0.077
0.25%
1 Jan 1991 Jahr
29.389
-1.768
-5.68%
1 Jan 1992 Jahr
33.864
+4.475
15.23%
1 Jan 1993 Jahr
35.677
+1.812
5.35%
1 Jan 1994 Jahr
34.665
-1.012
-2.84%
1 Jan 1995 Jahr
36.499
+1.834
5.29%
1 Jan 1996 Jahr
35.36
-1.139
-3.12%
1 Jan 1997 Jahr
37.445
+2.085
5.9%
1 Jan 1998 Jahr
36.907
-0.538
-1.44%
1 Jan 1999 Jahr
41.315
+4.407
11.94%
1 Jan 2000 Jahr
40.662
-0.653
-1.58%
1 Jan 2001 Jahr
40.61
-0.052
-0.13%
1 Jan 2002 Jahr
42.061
+1.452
3.57%
1 Jan 2003 Jahr
43.448
+1.386
3.3%
1 Jan 2004 Jahr
42.547
-0.901
-2.07%
1 Jan 2005 Jahr
42.142
-0.405
-0.95%
1 Jan 2006 Jahr
40.006
-2.135
-5.07%
1 Jan 2007 Jahr
40.442
+0.436
1.09%
1 Jan 2008 Jahr
39.892
-0.551
-1.36%
1 Jan 2009 Jahr
40.673
+0.781
1.96%
1 Jan 2010 Jahr
42.183
+1.51
3.71%
1 Jan 2011 Jahr
43.624
+1.441
3.42%
1 Jan 2012 Jahr
41.943
-1.681
-3.85%
1 Jan 2013 Jahr
41.54
-0.403
-0.96%
1 Jan 2014 Jahr
43.485
+1.945
4.68%
1 Jan 2015 Jahr
45.345
+1.86
4.28%
1 Jan 2016 Jahr
47.242
+1.897
4.18%
Bewertung der Länder gemäß mit laufender Statistik nach Jahren


Kommentare: