29
/de/
de
AIzaSyAYiBZKx7MnpbEhh9jyipgxe19OcubqV5w
April 1, 2024
256025
Sweden
SWE
true
2
1
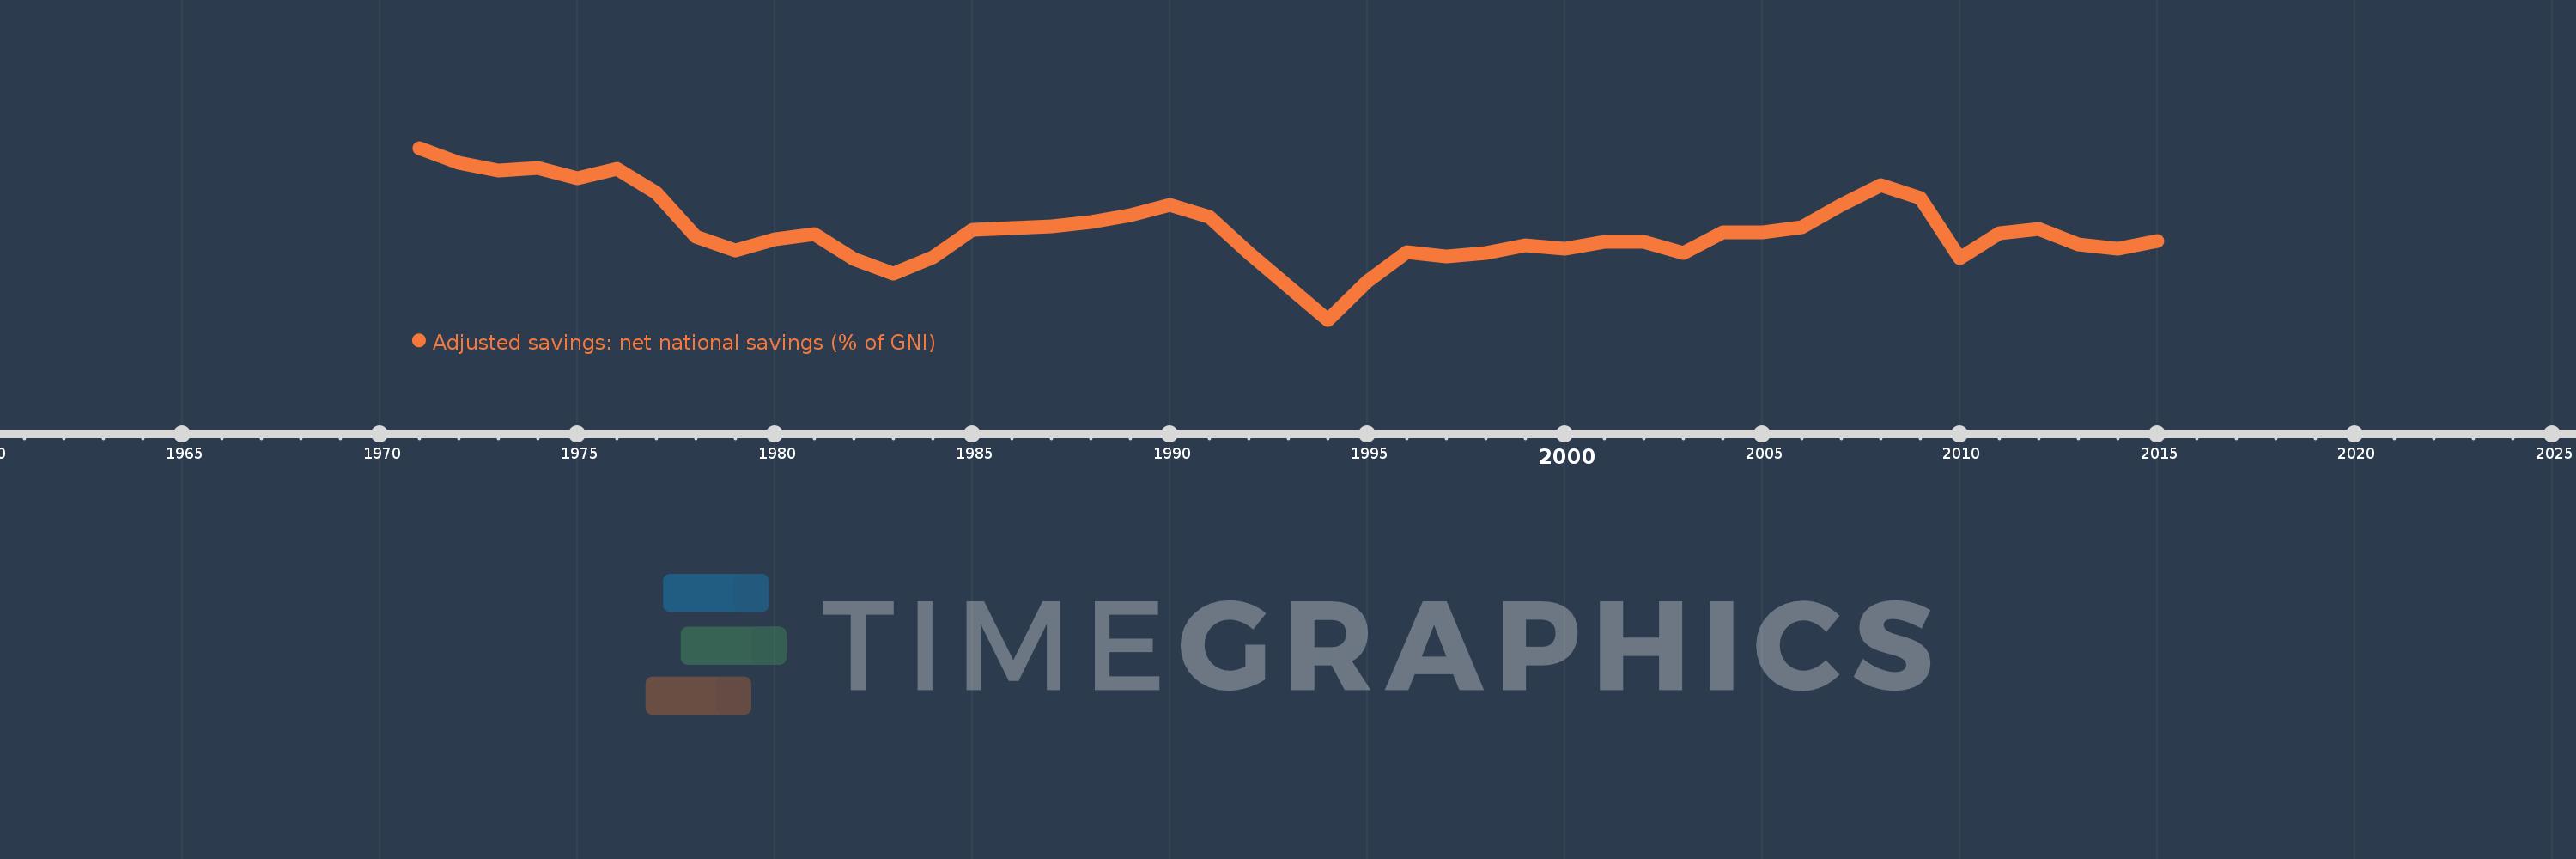
Adjusted savings: net national savings (% of GNI)
2015,2014,2013,2012,2011,2010,2009,2008,2007,2006,2005,2004,2003,2002,2001,2000,1999,1998,1997,1996,1995,1994,1993,1992,1991,1990,1989,1988,1987,1986,1985,1984,1983,1982,1981,1980,1979,1978,1977,1976,1975,1974,1973,1972,1971
Diese Statistik in anderen Ländern:
AfghanistanAlbaniaAlgeriaAngolaAntigua and BarbudaArab WorldArgentinaArmeniaAustraliaAustriaAzerbaijanBahamas, TheBahrainBangladeshBarbadosBelarusBelgiumBelizeBeninBermudaBhutanBoliviaBosnia and HerzegovinaBotswanaBrazilBrunei DarussalamBulgariaBurkina FasoBurundiCabo VerdeCambodiaCameroonCanadaCaribbean small statesCentral African RepublicCentral Europe and the BalticsChadChileChinaColombiaComorosCongo, Dem. Rep.Congo, Rep.Costa RicaCote d'IvoireCroatiaCyprusCzech RepublicDenmarkDjiboutiDominicaDominican RepublicEarly-demographic dividendEast Asia & PacificEast Asia & Pacific (excluding high income)East Asia & Pacific (IDA & IBRD countries)EcuadorEgypt, Arab Rep.El SalvadorEquatorial GuineaEritreaEstoniaEthiopiaEuro areaEurope & Central AsiaEurope & Central Asia (excluding high income)Europe & Central Asia (IDA & IBRD countries)European UnionFijiFinlandFragile and conflict affected situationsFranceGabonGambia, TheGeorgiaGermanyGhanaGreeceGrenadaGuatemalaGuineaGuinea-BissauGuyanaHaitiHeavily indebted poor countries (HIPC)High incomeHondurasHong Kong SAR, ChinaHungaryIBRD onlyIcelandIDA & IBRD totalIDA blendIDA onlyIDA totalIndiaIndonesiaIran, Islamic Rep.IraqIrelandIsraelItalyJamaicaJapanJordanKazakhstanKenyaKiribatiKorea, Rep.KosovoKuwaitKyrgyz RepublicLao PDRLate-demographic dividendLatin America & Caribbean Latin America & Caribbean (excluding high income)Latin America & the Caribbean (IDA & IBRD countries)LatviaLeast developed countries: UN classificationLebanonLesothoLiberiaLibyaLithuaniaLow & middle incomeLow incomeLower middle incomeLuxembourgMacao SAR, ChinaMacedonia, FYRMadagascarMalawiMalaysiaMaldivesMaliMaltaMauritaniaMauritiusMexicoMiddle East & North AfricaMiddle East & North Africa (excluding high income)Middle East & North Africa (IDA & IBRD countries)Middle incomeMoldovaMongoliaMontenegroMoroccoMozambiqueNamibiaNepalNetherlandsNew ZealandNicaraguaNigerNigeriaNorth AmericaNorwayOECD membersOmanOther small statesPacific island small statesPakistanPanamaPapua New GuineaParaguayPeruPhilippinesPolandPortugalPost-demographic dividendPre-demographic dividendQatarRomaniaRussian FederationRwandaSaudi ArabiaSenegalSerbiaSeychellesSierra LeoneSingaporeSlovak RepublicSloveniaSmall statesSolomon IslandsSouth AfricaSouth AsiaSouth Asia (IDA & IBRD)SpainSri LankaSt. Kitts and NevisSt. LuciaSt. Vincent and the GrenadinesSub-Saharan Africa Sub-Saharan Africa (excluding high income)Sub-Saharan Africa (IDA & IBRD countries)SudanSurinameSwazilandSwedenSwitzerlandSyrian Arab RepublicTajikistanTanzaniaThailandTimor-LesteTogoTongaTrinidad and TobagoTunisiaTurkeyTurkmenistanUgandaUkraineUnited KingdomUnited StatesUpper middle incomeUruguayVanuatuVenezuela, RBVietnamWest Bank and GazaWorldYemen, Rep.ZambiaZimbabwe Zeitlinie:
Diese Zeitleiste vorliegt die Graphik ab 1971 J. bis 2015 J. Sweden. Die Angaben bis 1970 J. sind nicht vorhanden. Die Zahl aktueller Beobachtungen nach Daten: 45.
Die Quelle (Bezeichnung):
Kennzahlen der Weltentwicklung
Die Quelle (Einrichtung):
World Bank staff estimates based on sources and methods in World Bank's "The Changing Wealth of Nations: Measuring Sustainable Development in the New Millennium" (2011).
Kategorien:
Economy & Growth, Environment
Es wurde aktualisiert:
23 Apr 2017 Jahr
Kennzahlen der Wertänderungen vom Jahr zum Jahr
Minimum:
3.464
1 Jan 1994 Jahr
Maximum:
22.237
1 Jan 1971 Jahr
Zum Datum der Beobachtung
Wert
Absolute Veränderung
Die Veränderung bezüglich dem vorherigen Wert
1 Jan 1971 Jahr
22.237
+22.237
0.0%
1 Jan 1972 Jahr
20.613
-1.624
-7.3%
1 Jan 1973 Jahr
19.784
-0.829
-4.02%
1 Jan 1974 Jahr
20.032
+0.248
1.25%
1 Jan 1975 Jahr
18.959
-1.073
-5.36%
1 Jan 1976 Jahr
19.923
+0.964
5.09%
1 Jan 1977 Jahr
17.308
-2.615
-13.12%
1 Jan 1978 Jahr
12.55
-4.758
-27.49%
1 Jan 1979 Jahr
11.003
-1.547
-12.33%
1 Jan 1980 Jahr
12.213
+1.21
11.0%
1 Jan 1981 Jahr
12.785
+0.572
4.69%
1 Jan 1982 Jahr
10.078
-2.707
-21.17%
1 Jan 1983 Jahr
8.504
-1.575
-15.62%
1 Jan 1984 Jahr
10.286
+1.782
20.96%
1 Jan 1985 Jahr
13.247
+2.961
28.79%
1 Jan 1986 Jahr
13.491
+0.244
1.84%
1 Jan 1987 Jahr
13.694
+0.203
1.5%
1 Jan 1988 Jahr
14.09
+0.396
2.89%
1 Jan 1989 Jahr
14.93
+0.84
5.96%
1 Jan 1990 Jahr
15.99
+1.06
7.1%
1 Jan 1991 Jahr
14.701
-1.288
-8.06%
1 Jan 1992 Jahr
10.727
-3.974
-27.03%
1 Jan 1993 Jahr
7.135
-3.592
-33.49%
1 Jan 1994 Jahr
3.464
-3.671
-51.45%
1 Jan 1995 Jahr
7.658
+4.194
121.09%
1 Jan 1996 Jahr
10.894
+3.235
42.25%
1 Jan 1997 Jahr
10.394
-0.499
-4.58%
1 Jan 1998 Jahr
10.753
+0.359
3.46%
1 Jan 1999 Jahr
11.57
+0.817
7.59%
1 Jan 2000 Jahr
11.222
-0.348
-3.01%
1 Jan 2001 Jahr
12.002
+0.78
6.95%
1 Jan 2002 Jahr
11.943
-0.059
-0.49%
1 Jan 2003 Jahr
10.785
-1.159
-9.7%
1 Jan 2004 Jahr
12.994
+2.209
20.48%
1 Jan 2005 Jahr
12.999
+0.005
0.04%
1 Jan 2006 Jahr
13.527
+0.528
4.06%
1 Jan 2007 Jahr
16.03
+2.502
18.5%
1 Jan 2008 Jahr
18.149
+2.119
13.22%
1 Jan 2009 Jahr
16.778
-1.371
-7.55%
1 Jan 2010 Jahr
10.154
-6.624
-39.48%
1 Jan 2011 Jahr
12.919
+2.765
27.23%
1 Jan 2012 Jahr
13.42
+0.501
3.88%
1 Jan 2013 Jahr
11.737
-1.684
-12.55%
1 Jan 2014 Jahr
11.222
-0.515
-4.39%
1 Jan 2015 Jahr
12.057
+0.836
7.45%
Bewertung der Länder gemäß mit laufender Statistik nach Jahren


Kommentare: