29
/de/
de
AIzaSyAYiBZKx7MnpbEhh9jyipgxe19OcubqV5w
April 1, 2024
155550
Indonesia
IDN
true
2
1
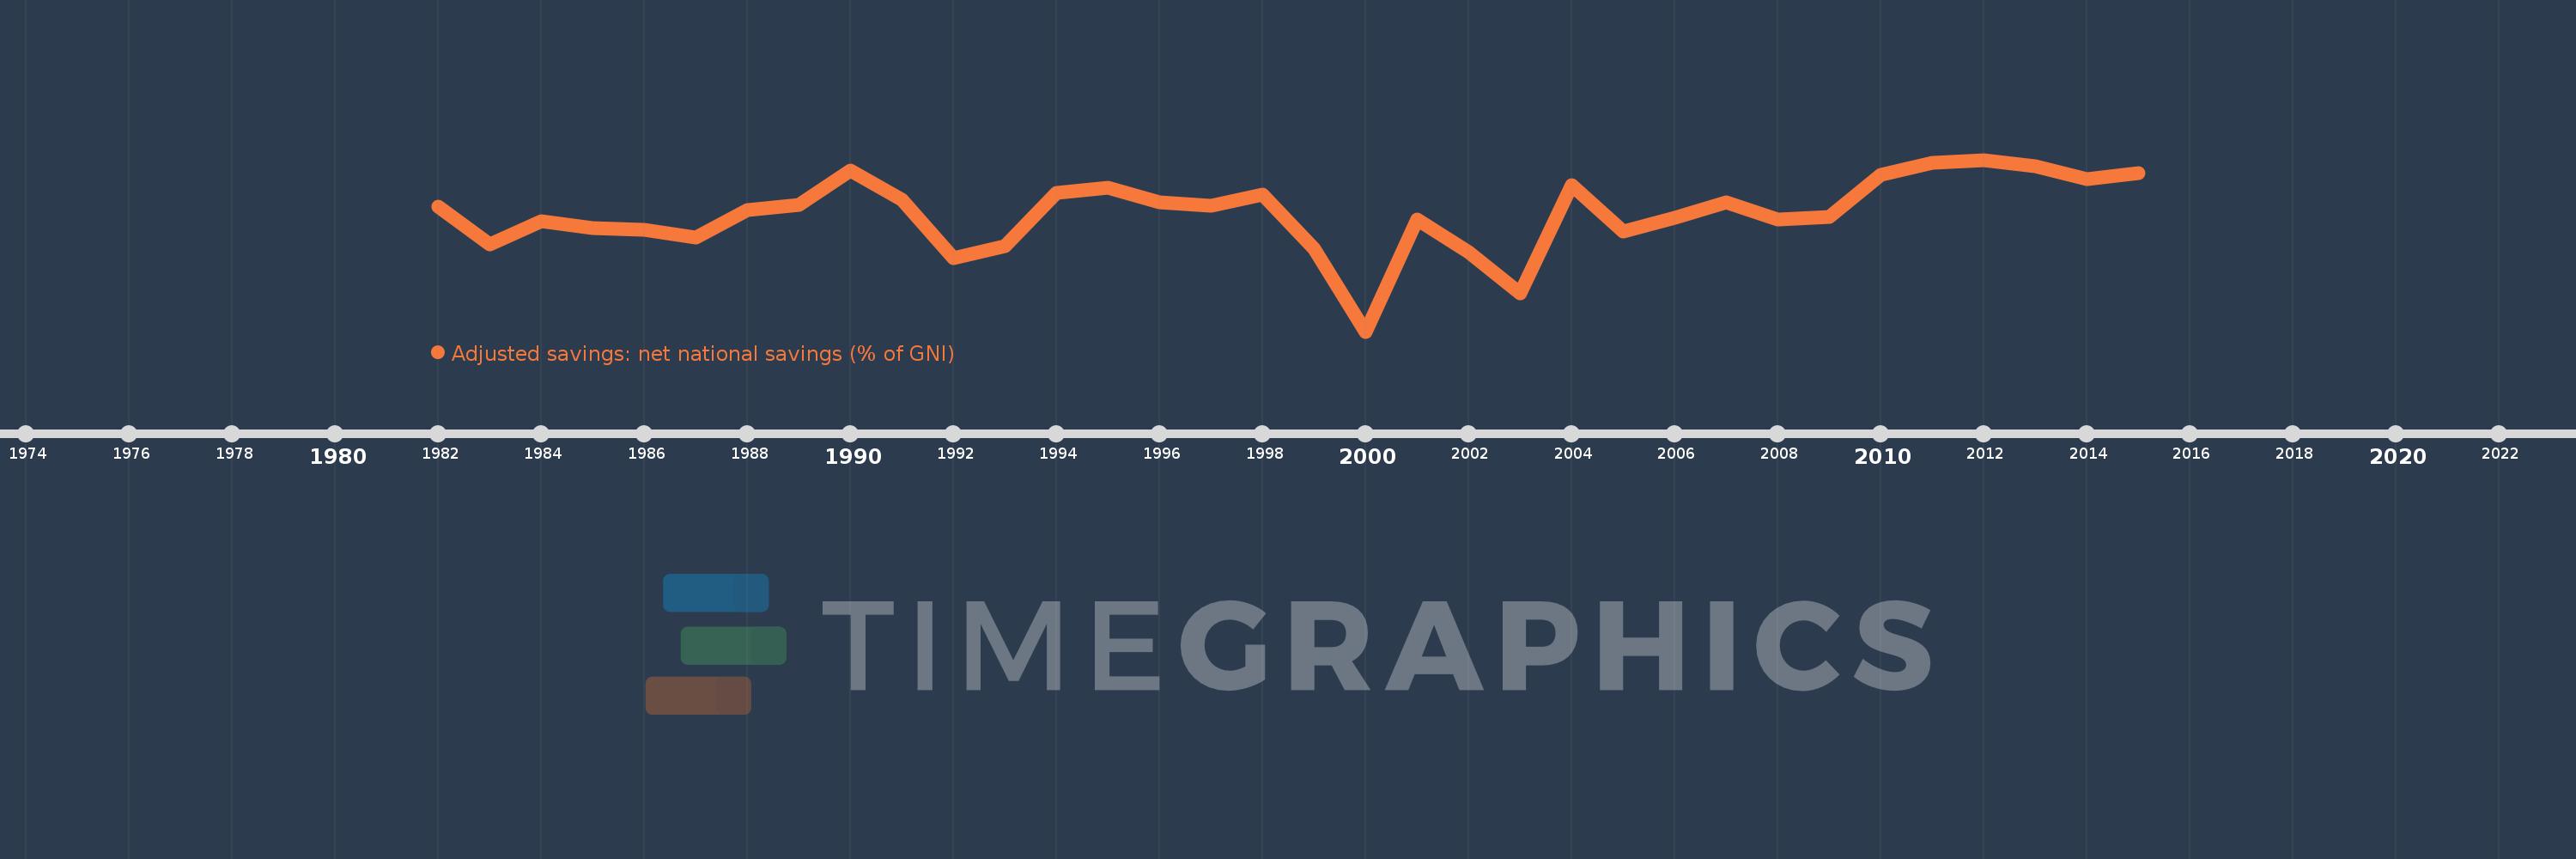
Adjusted savings: net national savings (% of GNI)
2015,2014,2013,2012,2011,2010,2009,2008,2007,2006,2005,2004,2003,2002,2001,2000,1999,1998,1997,1996,1995,1994,1993,1992,1991,1990,1989,1988,1987,1986,1985,1984,1983,1982
Diese Statistik in anderen Ländern:
AfghanistanAlbaniaAlgeriaAngolaAntigua and BarbudaArab WorldArgentinaArmeniaAustraliaAustriaAzerbaijanBahamas, TheBahrainBangladeshBarbadosBelarusBelgiumBelizeBeninBermudaBhutanBoliviaBosnia and HerzegovinaBotswanaBrazilBrunei DarussalamBulgariaBurkina FasoBurundiCabo VerdeCambodiaCameroonCanadaCaribbean small statesCentral African RepublicCentral Europe and the BalticsChadChileChinaColombiaComorosCongo, Dem. Rep.Congo, Rep.Costa RicaCote d'IvoireCroatiaCyprusCzech RepublicDenmarkDjiboutiDominicaDominican RepublicEarly-demographic dividendEast Asia & PacificEast Asia & Pacific (excluding high income)East Asia & Pacific (IDA & IBRD countries)EcuadorEgypt, Arab Rep.El SalvadorEquatorial GuineaEritreaEstoniaEthiopiaEuro areaEurope & Central AsiaEurope & Central Asia (excluding high income)Europe & Central Asia (IDA & IBRD countries)European UnionFijiFinlandFragile and conflict affected situationsFranceGabonGambia, TheGeorgiaGermanyGhanaGreeceGrenadaGuatemalaGuineaGuinea-BissauGuyanaHaitiHeavily indebted poor countries (HIPC)High incomeHondurasHong Kong SAR, ChinaHungaryIBRD onlyIcelandIDA & IBRD totalIDA blendIDA onlyIDA totalIndiaIndonesiaIran, Islamic Rep.IraqIrelandIsraelItalyJamaicaJapanJordanKazakhstanKenyaKiribatiKorea, Rep.KosovoKuwaitKyrgyz RepublicLao PDRLate-demographic dividendLatin America & Caribbean Latin America & Caribbean (excluding high income)Latin America & the Caribbean (IDA & IBRD countries)LatviaLeast developed countries: UN classificationLebanonLesothoLiberiaLibyaLithuaniaLow & middle incomeLow incomeLower middle incomeLuxembourgMacao SAR, ChinaMacedonia, FYRMadagascarMalawiMalaysiaMaldivesMaliMaltaMauritaniaMauritiusMexicoMiddle East & North AfricaMiddle East & North Africa (excluding high income)Middle East & North Africa (IDA & IBRD countries)Middle incomeMoldovaMongoliaMontenegroMoroccoMozambiqueNamibiaNepalNetherlandsNew ZealandNicaraguaNigerNigeriaNorth AmericaNorwayOECD membersOmanOther small statesPacific island small statesPakistanPanamaPapua New GuineaParaguayPeruPhilippinesPolandPortugalPost-demographic dividendPre-demographic dividendQatarRomaniaRussian FederationRwandaSaudi ArabiaSenegalSerbiaSeychellesSierra LeoneSingaporeSlovak RepublicSloveniaSmall statesSolomon IslandsSouth AfricaSouth AsiaSouth Asia (IDA & IBRD)SpainSri LankaSt. Kitts and NevisSt. LuciaSt. Vincent and the GrenadinesSub-Saharan Africa Sub-Saharan Africa (excluding high income)Sub-Saharan Africa (IDA & IBRD countries)SudanSurinameSwazilandSwedenSwitzerlandSyrian Arab RepublicTajikistanTanzaniaThailandTimor-LesteTogoTongaTrinidad and TobagoTunisiaTurkeyTurkmenistanUgandaUkraineUnited KingdomUnited StatesUpper middle incomeUruguayVanuatuVenezuela, RBVietnamWest Bank and GazaWorldYemen, Rep.ZambiaZimbabwe Zeitlinie:
Diese Zeitleiste vorliegt die Graphik ab 1982 J. bis 2015 J. Indonesia. Die Angaben bis 1981 J. sind nicht vorhanden. Die Zahl aktueller Beobachtungen nach Daten: 34.
Die Quelle (Bezeichnung):
Kennzahlen der Weltentwicklung
Die Quelle (Einrichtung):
World Bank staff estimates based on sources and methods in World Bank's "The Changing Wealth of Nations: Measuring Sustainable Development in the New Millennium" (2011).
Kategorien:
Economy & Growth, Environment
Es wurde aktualisiert:
23 Apr 2017 Jahr
Kennzahlen der Wertänderungen vom Jahr zum Jahr
Minimum:
8.865
1 Jan 2000 Jahr
Maximum:
28.814
1 Jan 2012 Jahr
Zum Datum der Beobachtung
Wert
Absolute Veränderung
Die Veränderung bezüglich dem vorherigen Wert
1 Jan 1982 Jahr
23.405
+23.405
0.0%
1 Jan 1983 Jahr
18.998
-4.407
-18.83%
1 Jan 1984 Jahr
21.722
+2.724
14.34%
1 Jan 1985 Jahr
20.912
-0.81
-3.73%
1 Jan 1986 Jahr
20.653
-0.259
-1.24%
1 Jan 1987 Jahr
19.815
-0.838
-4.06%
1 Jan 1988 Jahr
22.982
+3.167
15.98%
1 Jan 1989 Jahr
23.528
+0.546
2.38%
1 Jan 1990 Jahr
27.518
+3.99
16.96%
1 Jan 1991 Jahr
24.183
-3.335
-12.12%
1 Jan 1992 Jahr
17.399
-6.785
-28.05%
1 Jan 1993 Jahr
18.752
+1.353
7.78%
1 Jan 1994 Jahr
24.935
+6.183
32.97%
1 Jan 1995 Jahr
25.545
+0.609
2.44%
1 Jan 1996 Jahr
23.838
-1.706
-6.68%
1 Jan 1997 Jahr
23.433
-0.405
-1.7%
1 Jan 1998 Jahr
24.742
+1.309
5.59%
1 Jan 1999 Jahr
18.451
-6.292
-25.43%
1 Jan 2000 Jahr
8.865
-9.586
-51.95%
1 Jan 2001 Jahr
21.875
+13.01
146.76%
1 Jan 2002 Jahr
18.071
-3.804
-17.39%
1 Jan 2003 Jahr
13.262
-4.809
-26.61%
1 Jan 2004 Jahr
25.858
+12.596
94.98%
1 Jan 2005 Jahr
20.525
-5.333
-20.62%
1 Jan 2006 Jahr
22.096
+1.571
7.65%
1 Jan 2007 Jahr
23.904
+1.809
8.19%
1 Jan 2008 Jahr
21.92
-1.985
-8.3%
1 Jan 2009 Jahr
22.167
+0.247
1.13%
1 Jan 2010 Jahr
27.097
+4.93
22.24%
1 Jan 2011 Jahr
28.436
+1.339
4.94%
1 Jan 2012 Jahr
28.814
+0.378
1.33%
1 Jan 2013 Jahr
28.042
-0.772
-2.68%
1 Jan 2014 Jahr
26.533
-1.509
-5.38%
1 Jan 2015 Jahr
27.261
+0.728
2.74%
Bewertung der Länder gemäß mit laufender Statistik nach Jahren


Kommentare: