29
/de/
de
AIzaSyAYiBZKx7MnpbEhh9jyipgxe19OcubqV5w
April 1, 2024
136361
Gambia, The
GMB
true
2
1
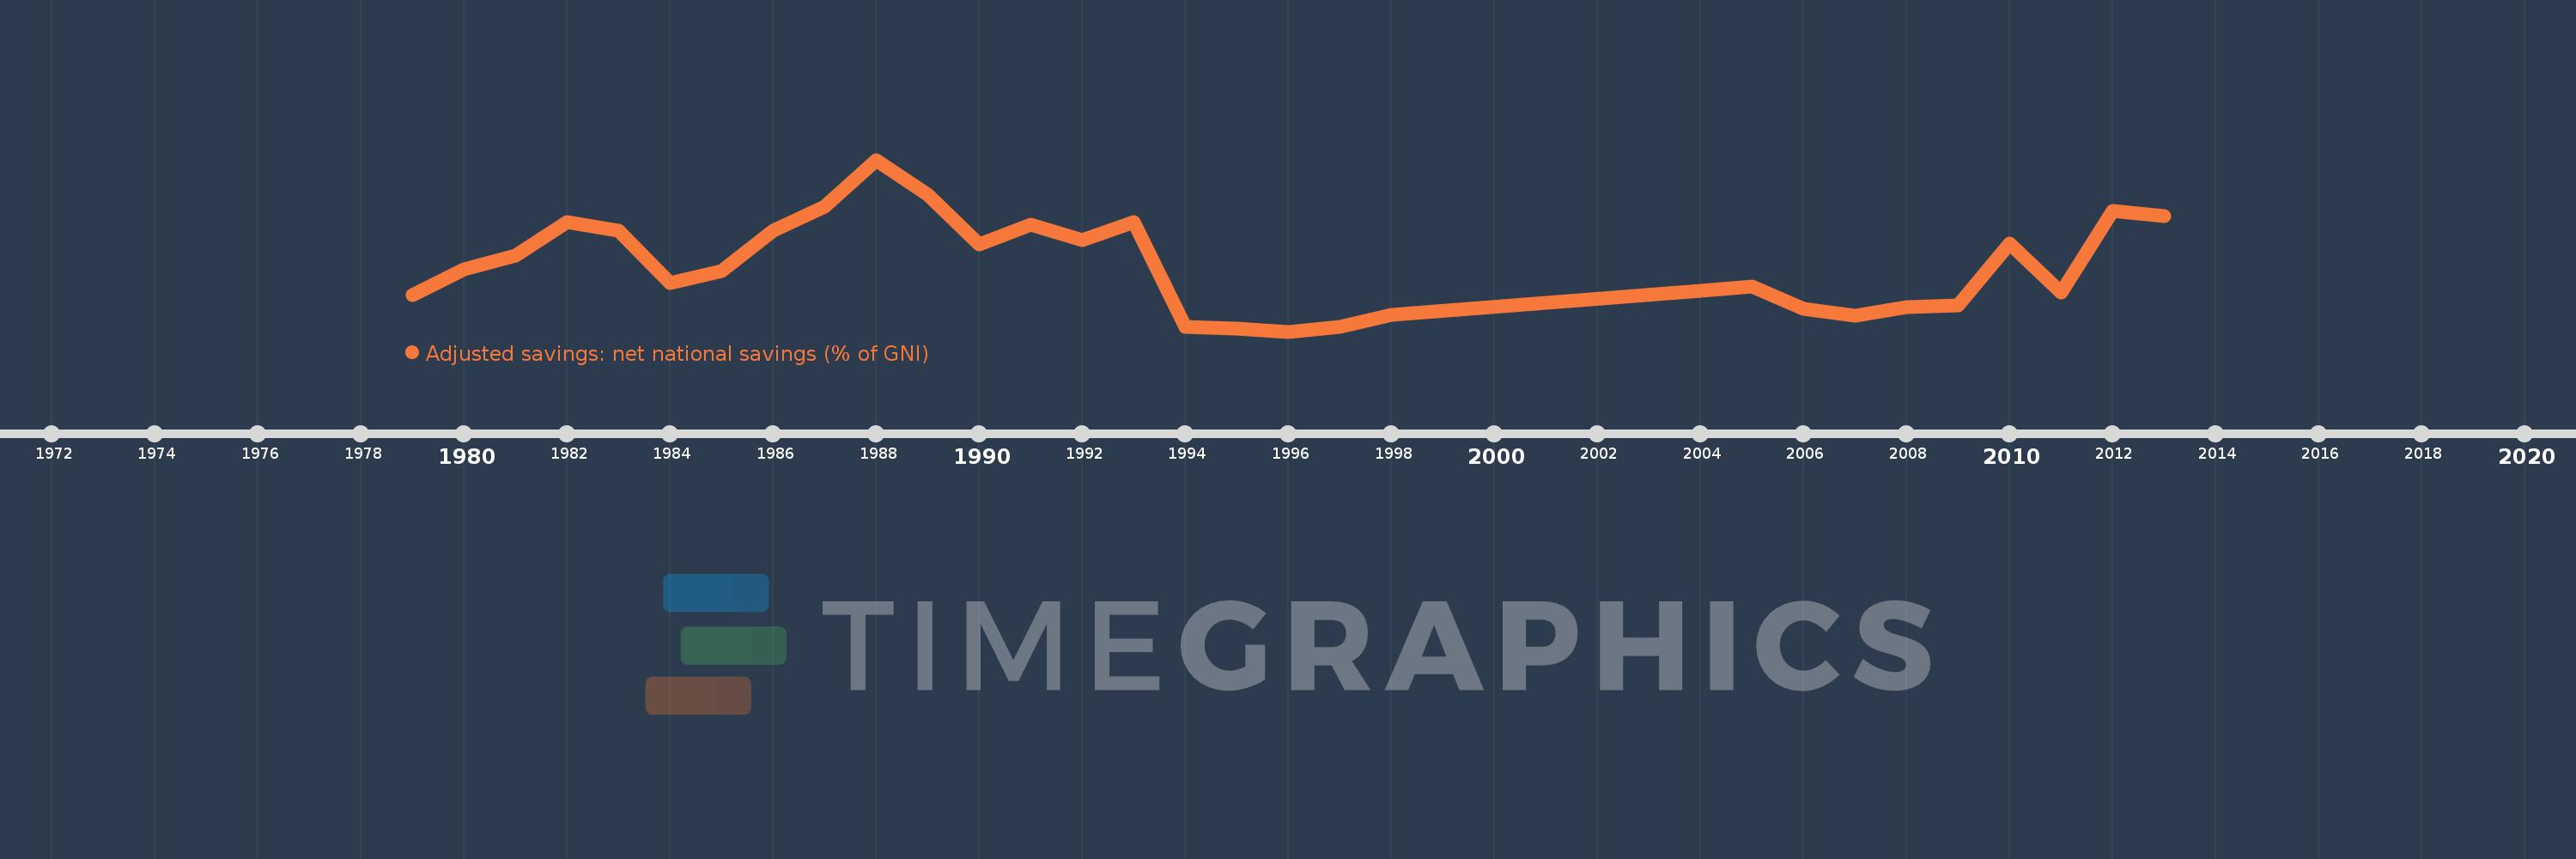
Adjusted savings: net national savings (% of GNI)
2013,2012,2011,2010,2009,2008,2007,2006,2005,2004,1998,1997,1996,1995,1994,1993,1992,1991,1990,1989,1988,1987,1986,1985,1984,1983,1982,1981,1980,1979
Diese Statistik in anderen Ländern:
AfghanistanAlbaniaAlgeriaAngolaAntigua and BarbudaArab WorldArgentinaArmeniaAustraliaAustriaAzerbaijanBahamas, TheBahrainBangladeshBarbadosBelarusBelgiumBelizeBeninBermudaBhutanBoliviaBosnia and HerzegovinaBotswanaBrazilBrunei DarussalamBulgariaBurkina FasoBurundiCabo VerdeCambodiaCameroonCanadaCaribbean small statesCentral African RepublicCentral Europe and the BalticsChadChileChinaColombiaComorosCongo, Dem. Rep.Congo, Rep.Costa RicaCote d'IvoireCroatiaCyprusCzech RepublicDenmarkDjiboutiDominicaDominican RepublicEarly-demographic dividendEast Asia & PacificEast Asia & Pacific (excluding high income)East Asia & Pacific (IDA & IBRD countries)EcuadorEgypt, Arab Rep.El SalvadorEquatorial GuineaEritreaEstoniaEthiopiaEuro areaEurope & Central AsiaEurope & Central Asia (excluding high income)Europe & Central Asia (IDA & IBRD countries)European UnionFijiFinlandFragile and conflict affected situationsFranceGabonGambia, TheGeorgiaGermanyGhanaGreeceGrenadaGuatemalaGuineaGuinea-BissauGuyanaHaitiHeavily indebted poor countries (HIPC)High incomeHondurasHong Kong SAR, ChinaHungaryIBRD onlyIcelandIDA & IBRD totalIDA blendIDA onlyIDA totalIndiaIndonesiaIran, Islamic Rep.IraqIrelandIsraelItalyJamaicaJapanJordanKazakhstanKenyaKiribatiKorea, Rep.KosovoKuwaitKyrgyz RepublicLao PDRLate-demographic dividendLatin America & Caribbean Latin America & Caribbean (excluding high income)Latin America & the Caribbean (IDA & IBRD countries)LatviaLeast developed countries: UN classificationLebanonLesothoLiberiaLibyaLithuaniaLow & middle incomeLow incomeLower middle incomeLuxembourgMacao SAR, ChinaMacedonia, FYRMadagascarMalawiMalaysiaMaldivesMaliMaltaMauritaniaMauritiusMexicoMiddle East & North AfricaMiddle East & North Africa (excluding high income)Middle East & North Africa (IDA & IBRD countries)Middle incomeMoldovaMongoliaMontenegroMoroccoMozambiqueNamibiaNepalNetherlandsNew ZealandNicaraguaNigerNigeriaNorth AmericaNorwayOECD membersOmanOther small statesPacific island small statesPakistanPanamaPapua New GuineaParaguayPeruPhilippinesPolandPortugalPost-demographic dividendPre-demographic dividendQatarRomaniaRussian FederationRwandaSaudi ArabiaSenegalSerbiaSeychellesSierra LeoneSingaporeSlovak RepublicSloveniaSmall statesSolomon IslandsSouth AfricaSouth AsiaSouth Asia (IDA & IBRD)SpainSri LankaSt. Kitts and NevisSt. LuciaSt. Vincent and the GrenadinesSub-Saharan Africa Sub-Saharan Africa (excluding high income)Sub-Saharan Africa (IDA & IBRD countries)SudanSurinameSwazilandSwedenSwitzerlandSyrian Arab RepublicTajikistanTanzaniaThailandTimor-LesteTogoTongaTrinidad and TobagoTunisiaTurkeyTurkmenistanUgandaUkraineUnited KingdomUnited StatesUpper middle incomeUruguayVanuatuVenezuela, RBVietnamWest Bank and GazaWorldYemen, Rep.ZambiaZimbabwe Zeitlinie:
Diese Zeitleiste vorliegt die Graphik ab 1979 J. bis 2013 J. Gambia, The. Die Angaben bis 1978 J. sind nicht vorhanden. Die Zahl aktueller Beobachtungen nach Daten: 30.
Die Quelle (Bezeichnung):
Kennzahlen der Weltentwicklung
Die Quelle (Einrichtung):
World Bank staff estimates based on sources and methods in World Bank's "The Changing Wealth of Nations: Measuring Sustainable Development in the New Millennium" (2011).
Kategorien:
Economy & Growth, Environment
Es wurde aktualisiert:
23 Apr 2017 Jahr
Kennzahlen der Wertänderungen vom Jahr zum Jahr
Minimum:
-13.878
1 Jan 1996 Jahr
Maximum:
26.859
1 Jan 1988 Jahr
Zum Datum der Beobachtung
Wert
Absolute Veränderung
Die Veränderung bezüglich dem vorherigen Wert
1 Jan 1979 Jahr
-5.162
-5.162
0.0%
1 Jan 1980 Jahr
0.927
+6.089
-117.95%
1 Jan 1981 Jahr
4.135
+3.208
346.22%
1 Jan 1982 Jahr
12.151
+8.016
193.87%
1 Jan 1983 Jahr
10.15
-2.001
-16.47%
1 Jan 1984 Jahr
-2.306
-12.456
-122.72%
1 Jan 1985 Jahr
0.535
+2.841
-123.2%
1 Jan 1986 Jahr
10.103
+9.568
1.79 Tsnd.%
1 Jan 1987 Jahr
15.855
+5.752
56.94%
1 Jan 1988 Jahr
26.859
+11.003
69.4%
1 Jan 1989 Jahr
18.518
-8.341
-31.05%
1 Jan 1990 Jahr
6.774
-11.744
-63.42%
1 Jan 1991 Jahr
11.433
+4.659
68.78%
1 Jan 1992 Jahr
7.897
-3.535
-30.92%
1 Jan 1993 Jahr
12.048
+4.15
52.56%
1 Jan 1994 Jahr
-12.692
-24.739
-205.35%
1 Jan 1995 Jahr
-13.236
-0.545
4.29%
1 Jan 1996 Jahr
-13.878
-0.641
4.84%
1 Jan 1997 Jahr
-12.707
+1.17
-8.43%
1 Jan 1998 Jahr
-9.981
+2.726
-21.46%
1 Jan 2004 Jahr
-4.153
+5.828
-58.39%
1 Jan 2005 Jahr
-3.165
+0.988
-23.79%
1 Jan 2006 Jahr
-8.463
-5.298
167.41%
1 Jan 2007 Jahr
-10.061
-1.597
18.87%
1 Jan 2008 Jahr
-8.087
+1.974
-19.62%
1 Jan 2009 Jahr
-7.755
+0.332
-4.1%
1 Jan 2010 Jahr
6.903
+14.658
-189.02%
1 Jan 2011 Jahr
-4.585
-11.488
-166.43%
1 Jan 2012 Jahr
14.773
+19.358
-422.17%
1 Jan 2013 Jahr
13.436
-1.337
-9.05%
Bewertung der Länder gemäß mit laufender Statistik nach Jahren


Kommentare: