29
/de/
de
AIzaSyAYiBZKx7MnpbEhh9jyipgxe19OcubqV5w
April 1, 2024
238112
Seychelles
SYC
true
2
1
Commercial service imports (current US$)
2016,2015,2014,2013,2012,2011,2010,2009,2008,2007,2006,2005,2004,2003,2002,2001,2000,1999,1998,1997,1996,1995,1994,1993,1992,1991,1990,1989,1988,1987,1986,1985,1984,1983,1982,1981,1980,1979,1978,1977
Diese Statistik in anderen Ländern:
AfghanistanAlbaniaAlgeriaAngolaAntigua and BarbudaArab WorldArgentinaArmeniaArubaAustraliaAustriaAzerbaijanBahamas, TheBahrainBangladeshBarbadosBelarusBelgiumBelizeBeninBermudaBhutanBoliviaBosnia and HerzegovinaBotswanaBrazilBrunei DarussalamBulgariaBurkina FasoBurundiCabo VerdeCambodiaCameroonCanadaCaribbean small statesCentral African RepublicCentral Europe and the BalticsChadChileChinaColombiaComorosCongo, Dem. Rep.Congo, Rep.Costa RicaCote d'IvoireCroatiaCuracaoCyprusCzech RepublicDenmarkDjiboutiDominicaDominican RepublicEarly-demographic dividendEast Asia & PacificEast Asia & Pacific (excluding high income)East Asia & Pacific (IDA & IBRD countries)EcuadorEgypt, Arab Rep.El SalvadorEquatorial GuineaEritreaEstoniaEthiopiaEuro areaEurope & Central AsiaEurope & Central Asia (excluding high income)Europe & Central Asia (IDA & IBRD countries)European UnionFaroe IslandsFijiFinlandFragile and conflict affected situationsFranceFrench PolynesiaGabonGambia, TheGeorgiaGermanyGhanaGreeceGrenadaGuatemalaGuineaGuinea-BissauGuyanaHaitiHeavily indebted poor countries (HIPC)High incomeHondurasHong Kong SAR, ChinaHungaryIBRD onlyIcelandIDA & IBRD totalIDA blendIDA onlyIDA totalIndiaIndonesiaIran, Islamic Rep.IraqIrelandIsraelItalyJamaicaJapanJordanKazakhstanKenyaKiribatiKorea, Rep.KosovoKuwaitKyrgyz RepublicLao PDRLate-demographic dividendLatin America & Caribbean Latin America & Caribbean (excluding high income)Latin America & the Caribbean (IDA & IBRD countries)LatviaLeast developed countries: UN classificationLebanonLesothoLiberiaLibyaLithuaniaLow & middle incomeLow incomeLower middle incomeLuxembourgMacao SAR, ChinaMacedonia, FYRMadagascarMalawiMalaysiaMaldivesMaliMaltaMarshall IslandsMauritaniaMauritiusMexicoMicronesia, Fed. Sts.Middle East & North Africa (excluding high income)Middle East & North Africa (IDA & IBRD countries)Middle incomeMoldovaMongoliaMontenegroMoroccoMozambiqueMyanmarNamibiaNepalNetherlandsNew CaledoniaNew ZealandNicaraguaNigerNigeriaNorth AmericaNorwayOECD membersOmanOther small statesPacific island small statesPakistanPalauPanamaPapua New GuineaParaguayPeruPhilippinesPolandPortugalPost-demographic dividendPre-demographic dividendQatarRomaniaRussian FederationRwandaSamoaSao Tome and PrincipeSaudi ArabiaSenegalSerbiaSeychellesSierra LeoneSingaporeSint Maarten (Dutch part)Slovak RepublicSloveniaSmall statesSolomon IslandsSouth AfricaSouth AsiaSouth Asia (IDA & IBRD)South SudanSpainSri LankaSt. Kitts and NevisSt. LuciaSt. Vincent and the GrenadinesSub-Saharan Africa Sub-Saharan Africa (excluding high income)Sub-Saharan Africa (IDA & IBRD countries)SudanSurinameSwazilandSwedenSwitzerlandSyrian Arab RepublicTajikistanTanzaniaThailandTimor-LesteTogoTongaTrinidad and TobagoTunisiaTurkeyTuvaluUgandaUkraineUnited KingdomUnited StatesUpper middle incomeUruguayVanuatuVenezuela, RBVietnamWest Bank and GazaWorldYemen, Rep.ZambiaZimbabwe Zeitlinie:
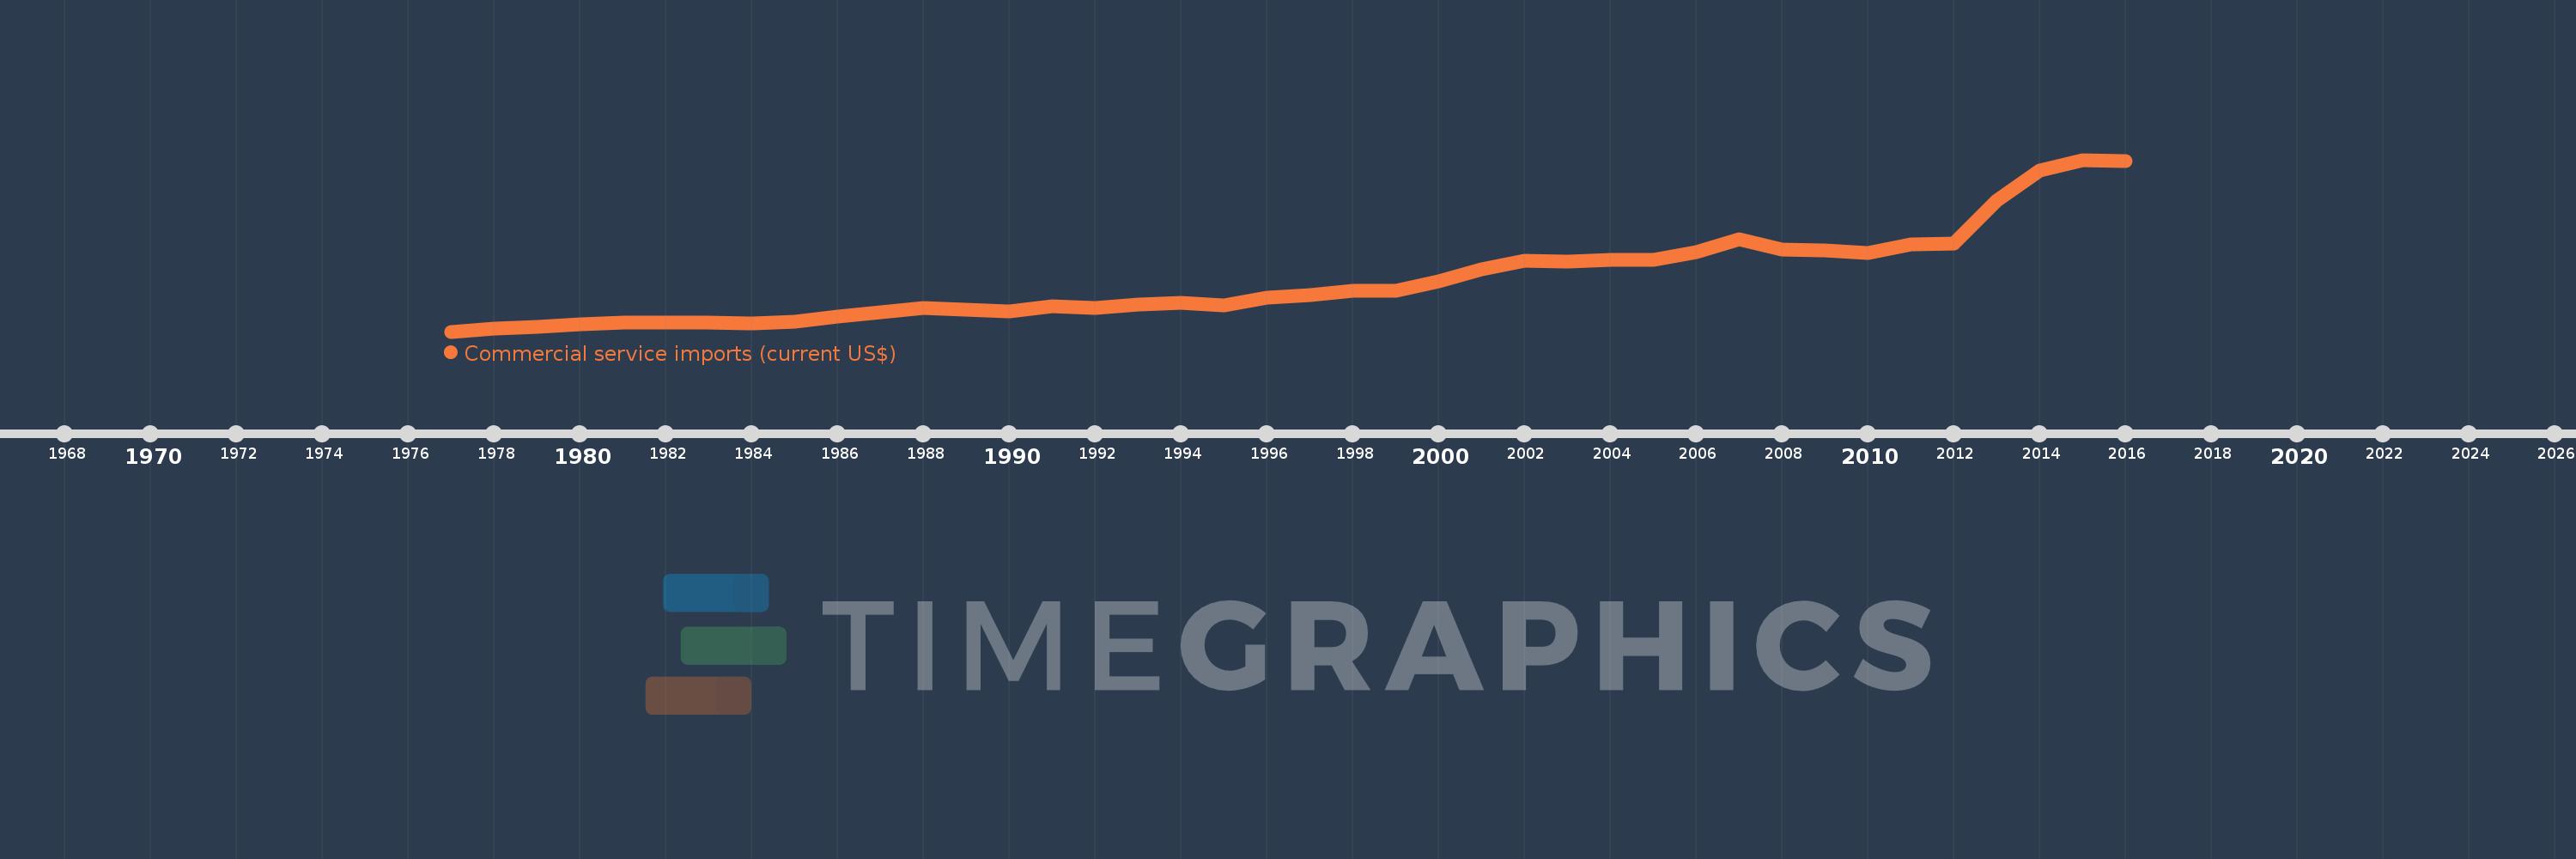
Diese Zeitleiste vorliegt die Graphik ab 1977 J. bis 2016 J. Seychelles. Die Angaben bis 1976 J. sind nicht vorhanden. Die Zahl aktueller Beobachtungen nach Daten: 40.
Die Quelle (Bezeichnung):
Kennzahlen der Weltentwicklung
Die Quelle (Einrichtung):
International Monetary Fund, Balance of Payments Statistics Yearbook and data files.
Kategorien:
Private Sector, Trade
Es wurde aktualisiert:
23 Apr 2017 Jahr
Kennzahlen der Wertänderungen vom Jahr zum Jahr
im Durchschnitt:
157.191 Mln.
Minimum:
10.028 Mln.
1 Jan 1977 Jahr
Maximum:
500.31 Mln.
1 Jan 2015 Jahr
Zum Datum der Beobachtung
Wert
Absolute Veränderung
Die Veränderung bezüglich dem vorherigen Wert
1 Jan 1977 Jahr
10.028 Mln.
+10.028 Mln.
0.0%
1 Jan 1978 Jahr
18.578 Mln.
+8.55 Mln.
85.25%
1 Jan 1979 Jahr
23.891 Mln.
+5.313 Mln.
28.6%
1 Jan 1980 Jahr
31.448 Mln.
+7.558 Mln.
31.63%
1 Jan 1981 Jahr
34.675 Mln.
+3.227 Mln.
10.26%
1 Jan 1982 Jahr
35.896 Mln.
+1.221 Mln.
3.52%
1 Jan 1983 Jahr
34.602 Mln.
-1.294 Mln.
-3.61%
1 Jan 1984 Jahr
33.106 Mln.
-1.496 Mln.
-4.32%
1 Jan 1985 Jahr
39.084 Mln.
+5.979 Mln.
18.06%
1 Jan 1986 Jahr
52.773 Mln.
+13.689 Mln.
35.02%
1 Jan 1987 Jahr
65.212 Mln.
+12.439 Mln.
23.57%
1 Jan 1988 Jahr
77.699 Mln.
+12.486 Mln.
19.15%
1 Jan 1989 Jahr
72.192 Mln.
-5.507 Mln.
-7.09%
1 Jan 1990 Jahr
66.47 Mln.
-5.722 Mln.
-7.93%
1 Jan 1991 Jahr
81.234 Mln.
+14.764 Mln.
22.21%
1 Jan 1992 Jahr
77.49 Mln.
-3.744 Mln.
-4.61%
1 Jan 1993 Jahr
87.684 Mln.
+10.194 Mln.
13.16%
1 Jan 1994 Jahr
91.961 Mln.
+4.277 Mln.
4.88%
1 Jan 1995 Jahr
85.153 Mln.
-6.808 Mln.
-7.4%
1 Jan 1996 Jahr
106.46 Mln.
+21.307 Mln.
25.02%
1 Jan 1997 Jahr
114.292 Mln.
+7.832 Mln.
7.36%
1 Jan 1998 Jahr
125.887 Mln.
+11.594 Mln.
10.14%
1 Jan 1999 Jahr
127.356 Mln.
+1.469 Mln.
1.17%
1 Jan 2000 Jahr
152.93 Mln.
+25.574 Mln.
20.08%
1 Jan 2001 Jahr
188.237 Mln.
+35.307 Mln.
23.09%
1 Jan 2002 Jahr
213.272 Mln.
+25.035 Mln.
13.3%
1 Jan 2003 Jahr
210.737 Mln.
-2.534 Mln.
-1.19%
1 Jan 2004 Jahr
213.879 Mln.
+3.142 Mln.
1.49%
1 Jan 2005 Jahr
215.937 Mln.
+2.058 Mln.
0.96%
1 Jan 2006 Jahr
236.899 Mln.
+20.962 Mln.
9.71%
1 Jan 2007 Jahr
273.97 Mln.
+37.071 Mln.
15.65%
1 Jan 2008 Jahr
243.185 Mln.
-30.785 Mln.
-11.24%
1 Jan 2009 Jahr
241.166 Mln.
-2.02 Mln.
-0.83%
1 Jan 2010 Jahr
235.07 Mln.
-6.095 Mln.
-2.53%
1 Jan 2011 Jahr
259.17 Mln.
+24.1 Mln.
10.25%
1 Jan 2012 Jahr
261.821 Mln.
+2.65 Mln.
1.02%
1 Jan 2013 Jahr
382.685 Mln.
+120.864 Mln.
46.16%
1 Jan 2014 Jahr
469.363 Mln.
+86.678 Mln.
22.65%
1 Jan 2015 Jahr
500.31 Mln.
+30.947 Mln.
6.59%
1 Jan 2016 Jahr
495.821 Mln.
-4.49 Mln.
-0.9%
Bewertung der Länder gemäß mit laufender Statistik nach Jahren


Kommentare: