29
/de/
de
AIzaSyAYiBZKx7MnpbEhh9jyipgxe19OcubqV5w
April 1, 2024
228244
Romania
ROU
true
2
1
Commercial service imports (current US$)
2016,2015,2014,2013,2012,2011,2010,2009,2008,2007,2006,2005,2004,2003,2002,2001,2000,1999,1998,1997,1996,1995,1994,1993,1992,1991,1990,1989,1988,1987,1986,1985,1984,1983,1982,1981,1980,1979,1978,1977,1976,1975,1974,1973,1972
Diese Statistik in anderen Ländern:
AfghanistanAlbaniaAlgeriaAngolaAntigua and BarbudaArab WorldArgentinaArmeniaArubaAustraliaAustriaAzerbaijanBahamas, TheBahrainBangladeshBarbadosBelarusBelgiumBelizeBeninBermudaBhutanBoliviaBosnia and HerzegovinaBotswanaBrazilBrunei DarussalamBulgariaBurkina FasoBurundiCabo VerdeCambodiaCameroonCanadaCaribbean small statesCentral African RepublicCentral Europe and the BalticsChadChileChinaColombiaComorosCongo, Dem. Rep.Congo, Rep.Costa RicaCote d'IvoireCroatiaCuracaoCyprusCzech RepublicDenmarkDjiboutiDominicaDominican RepublicEarly-demographic dividendEast Asia & PacificEast Asia & Pacific (excluding high income)East Asia & Pacific (IDA & IBRD countries)EcuadorEgypt, Arab Rep.El SalvadorEquatorial GuineaEritreaEstoniaEthiopiaEuro areaEurope & Central AsiaEurope & Central Asia (excluding high income)Europe & Central Asia (IDA & IBRD countries)European UnionFaroe IslandsFijiFinlandFragile and conflict affected situationsFranceFrench PolynesiaGabonGambia, TheGeorgiaGermanyGhanaGreeceGrenadaGuatemalaGuineaGuinea-BissauGuyanaHaitiHeavily indebted poor countries (HIPC)High incomeHondurasHong Kong SAR, ChinaHungaryIBRD onlyIcelandIDA & IBRD totalIDA blendIDA onlyIDA totalIndiaIndonesiaIran, Islamic Rep.IraqIrelandIsraelItalyJamaicaJapanJordanKazakhstanKenyaKiribatiKorea, Rep.KosovoKuwaitKyrgyz RepublicLao PDRLate-demographic dividendLatin America & Caribbean Latin America & Caribbean (excluding high income)Latin America & the Caribbean (IDA & IBRD countries)LatviaLeast developed countries: UN classificationLebanonLesothoLiberiaLibyaLithuaniaLow & middle incomeLow incomeLower middle incomeLuxembourgMacao SAR, ChinaMacedonia, FYRMadagascarMalawiMalaysiaMaldivesMaliMaltaMarshall IslandsMauritaniaMauritiusMexicoMicronesia, Fed. Sts.Middle East & North Africa (excluding high income)Middle East & North Africa (IDA & IBRD countries)Middle incomeMoldovaMongoliaMontenegroMoroccoMozambiqueMyanmarNamibiaNepalNetherlandsNew CaledoniaNew ZealandNicaraguaNigerNigeriaNorth AmericaNorwayOECD membersOmanOther small statesPacific island small statesPakistanPalauPanamaPapua New GuineaParaguayPeruPhilippinesPolandPortugalPost-demographic dividendPre-demographic dividendQatarRomaniaRussian FederationRwandaSamoaSao Tome and PrincipeSaudi ArabiaSenegalSerbiaSeychellesSierra LeoneSingaporeSint Maarten (Dutch part)Slovak RepublicSloveniaSmall statesSolomon IslandsSouth AfricaSouth AsiaSouth Asia (IDA & IBRD)South SudanSpainSri LankaSt. Kitts and NevisSt. LuciaSt. Vincent and the GrenadinesSub-Saharan Africa Sub-Saharan Africa (excluding high income)Sub-Saharan Africa (IDA & IBRD countries)SudanSurinameSwazilandSwedenSwitzerlandSyrian Arab RepublicTajikistanTanzaniaThailandTimor-LesteTogoTongaTrinidad and TobagoTunisiaTurkeyTuvaluUgandaUkraineUnited KingdomUnited StatesUpper middle incomeUruguayVanuatuVenezuela, RBVietnamWest Bank and GazaWorldYemen, Rep.ZambiaZimbabwe Zeitlinie:
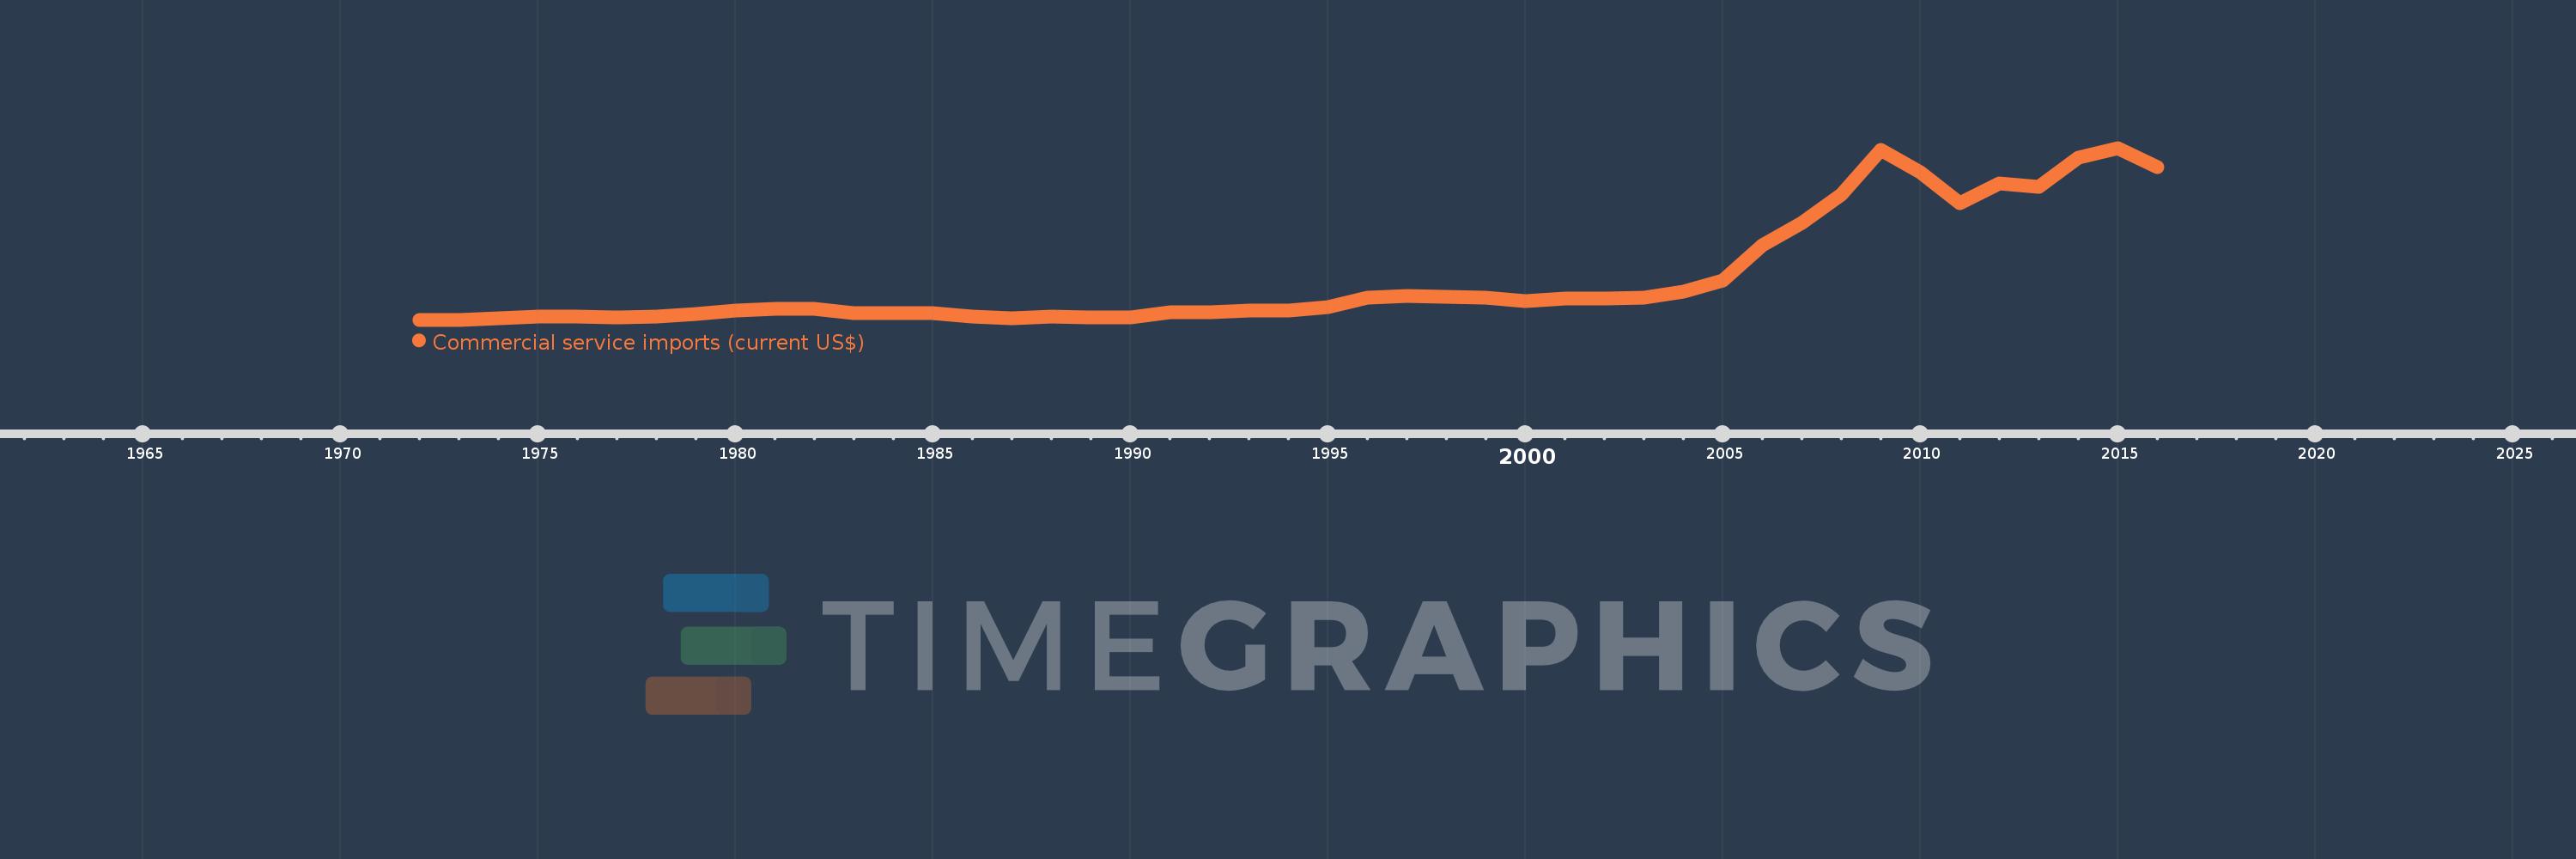
Diese Zeitleiste vorliegt die Graphik ab 1972 J. bis 2016 J. Romania. Die Angaben bis 1971 J. sind nicht vorhanden. Die Zahl aktueller Beobachtungen nach Daten: 45.
Die Quelle (Bezeichnung):
Kennzahlen der Weltentwicklung
Die Quelle (Einrichtung):
International Monetary Fund, Balance of Payments Statistics Yearbook and data files.
Kategorien:
Private Sector, Trade
Es wurde aktualisiert:
23 Apr 2017 Jahr
Kennzahlen der Wertänderungen vom Jahr zum Jahr
im Durchschnitt:
3.123 Mlrd.
Minimum:
295.0 Mln.
1 Jan 1973 Jahr
Maximum:
12.065 Mlrd.
1 Jan 2015 Jahr
Zum Datum der Beobachtung
Wert
Absolute Veränderung
Die Veränderung bezüglich dem vorherigen Wert
1 Jan 1972 Jahr
303.0 Mln.
+303.0 Mln.
0.0%
1 Jan 1973 Jahr
295.0 Mln.
-8.0 Mln.
-2.64%
1 Jan 1974 Jahr
373.0 Mln.
+78.0 Mln.
26.44%
1 Jan 1975 Jahr
518.0 Mln.
+145.0 Mln.
38.87%
1 Jan 1976 Jahr
516.0 Mln.
-2.0 Mln.
-0.39%
1 Jan 1977 Jahr
453.0 Mln.
-63.0 Mln.
-12.21%
1 Jan 1978 Jahr
527.0 Mln.
+74.0 Mln.
16.34%
1 Jan 1979 Jahr
691.0 Mln.
+164.0 Mln.
31.12%
1 Jan 1980 Jahr
909.0 Mln.
+218.0 Mln.
31.55%
1 Jan 1981 Jahr
1.045 Mlrd.
+136.0 Mln.
14.96%
1 Jan 1982 Jahr
1.014 Mlrd.
-31.0 Mln.
-2.97%
1 Jan 1983 Jahr
748.0 Mln.
-266.0 Mln.
-26.23%
1 Jan 1984 Jahr
726.0 Mln.
-22.0 Mln.
-2.94%
1 Jan 1985 Jahr
774.0 Mln.
+48.0 Mln.
6.61%
1 Jan 1986 Jahr
524.0 Mln.
-250.0 Mln.
-32.3%
1 Jan 1987 Jahr
424.0 Mln.
-100.0 Mln.
-19.08%
1 Jan 1988 Jahr
515.0 Mln.
+91.0 Mln.
21.46%
1 Jan 1989 Jahr
480.0 Mln.
-35.0 Mln.
-6.8%
1 Jan 1990 Jahr
450.0 Mln.
-30.0 Mln.
-6.25%
1 Jan 1991 Jahr
787.0 Mln.
+337.0 Mln.
74.89%
1 Jan 1992 Jahr
819.0 Mln.
+32.0 Mln.
4.07%
1 Jan 1993 Jahr
946.0 Mln.
+127.0 Mln.
15.51%
1 Jan 1994 Jahr
914.0 Mln.
-32.0 Mln.
-3.38%
1 Jan 1995 Jahr
1.173 Mlrd.
+259.0 Mln.
28.34%
1 Jan 1996 Jahr
1.814 Mlrd.
+641.0 Mln.
54.65%
1 Jan 1997 Jahr
1.927 Mlrd.
+113.0 Mln.
6.23%
1 Jan 1998 Jahr
1.872 Mlrd.
-55.0 Mln.
-2.85%
1 Jan 1999 Jahr
1.803 Mlrd.
-69.0 Mln.
-3.69%
1 Jan 2000 Jahr
1.584 Mlrd.
-219.0 Mln.
-12.15%
1 Jan 2001 Jahr
1.747 Mlrd.
+163.0 Mln.
10.29%
1 Jan 2002 Jahr
1.777 Mlrd.
+30.0 Mln.
1.72%
1 Jan 2003 Jahr
1.795 Mlrd.
+18.0 Mln.
1.01%
1 Jan 2004 Jahr
2.203 Mlrd.
+408.0 Mln.
22.73%
1 Jan 2005 Jahr
2.962 Mlrd.
+759.0 Mln.
34.45%
1 Jan 2006 Jahr
5.406 Mlrd.
+2.444 Mlrd.
82.5%
1 Jan 2007 Jahr
6.934 Mlrd.
+1.528 Mlrd.
28.27%
1 Jan 2008 Jahr
8.887 Mlrd.
+1.953 Mlrd.
28.17%
1 Jan 2009 Jahr
11.941 Mlrd.
+3.054 Mlrd.
34.36%
1 Jan 2010 Jahr
10.379 Mlrd.
-1.561 Mlrd.
-13.08%
1 Jan 2011 Jahr
8.26 Mlrd.
-2.12 Mlrd.
-20.42%
1 Jan 2012 Jahr
9.656 Mlrd.
+1.397 Mlrd.
16.91%
1 Jan 2013 Jahr
9.386 Mlrd.
-270.211 Mln.
-2.8%
1 Jan 2014 Jahr
11.425 Mlrd.
+2.039 Mlrd.
21.72%
1 Jan 2015 Jahr
12.065 Mlrd.
+639.932 Mln.
5.6%
1 Jan 2016 Jahr
10.779 Mlrd.
-1.286 Mlrd.
-10.66%
Bewertung der Länder gemäß mit laufender Statistik nach Jahren


Kommentare: