29
/de/
de
AIzaSyAYiBZKx7MnpbEhh9jyipgxe19OcubqV5w
April 1, 2024
191225
Malta
MLT
true
2
1
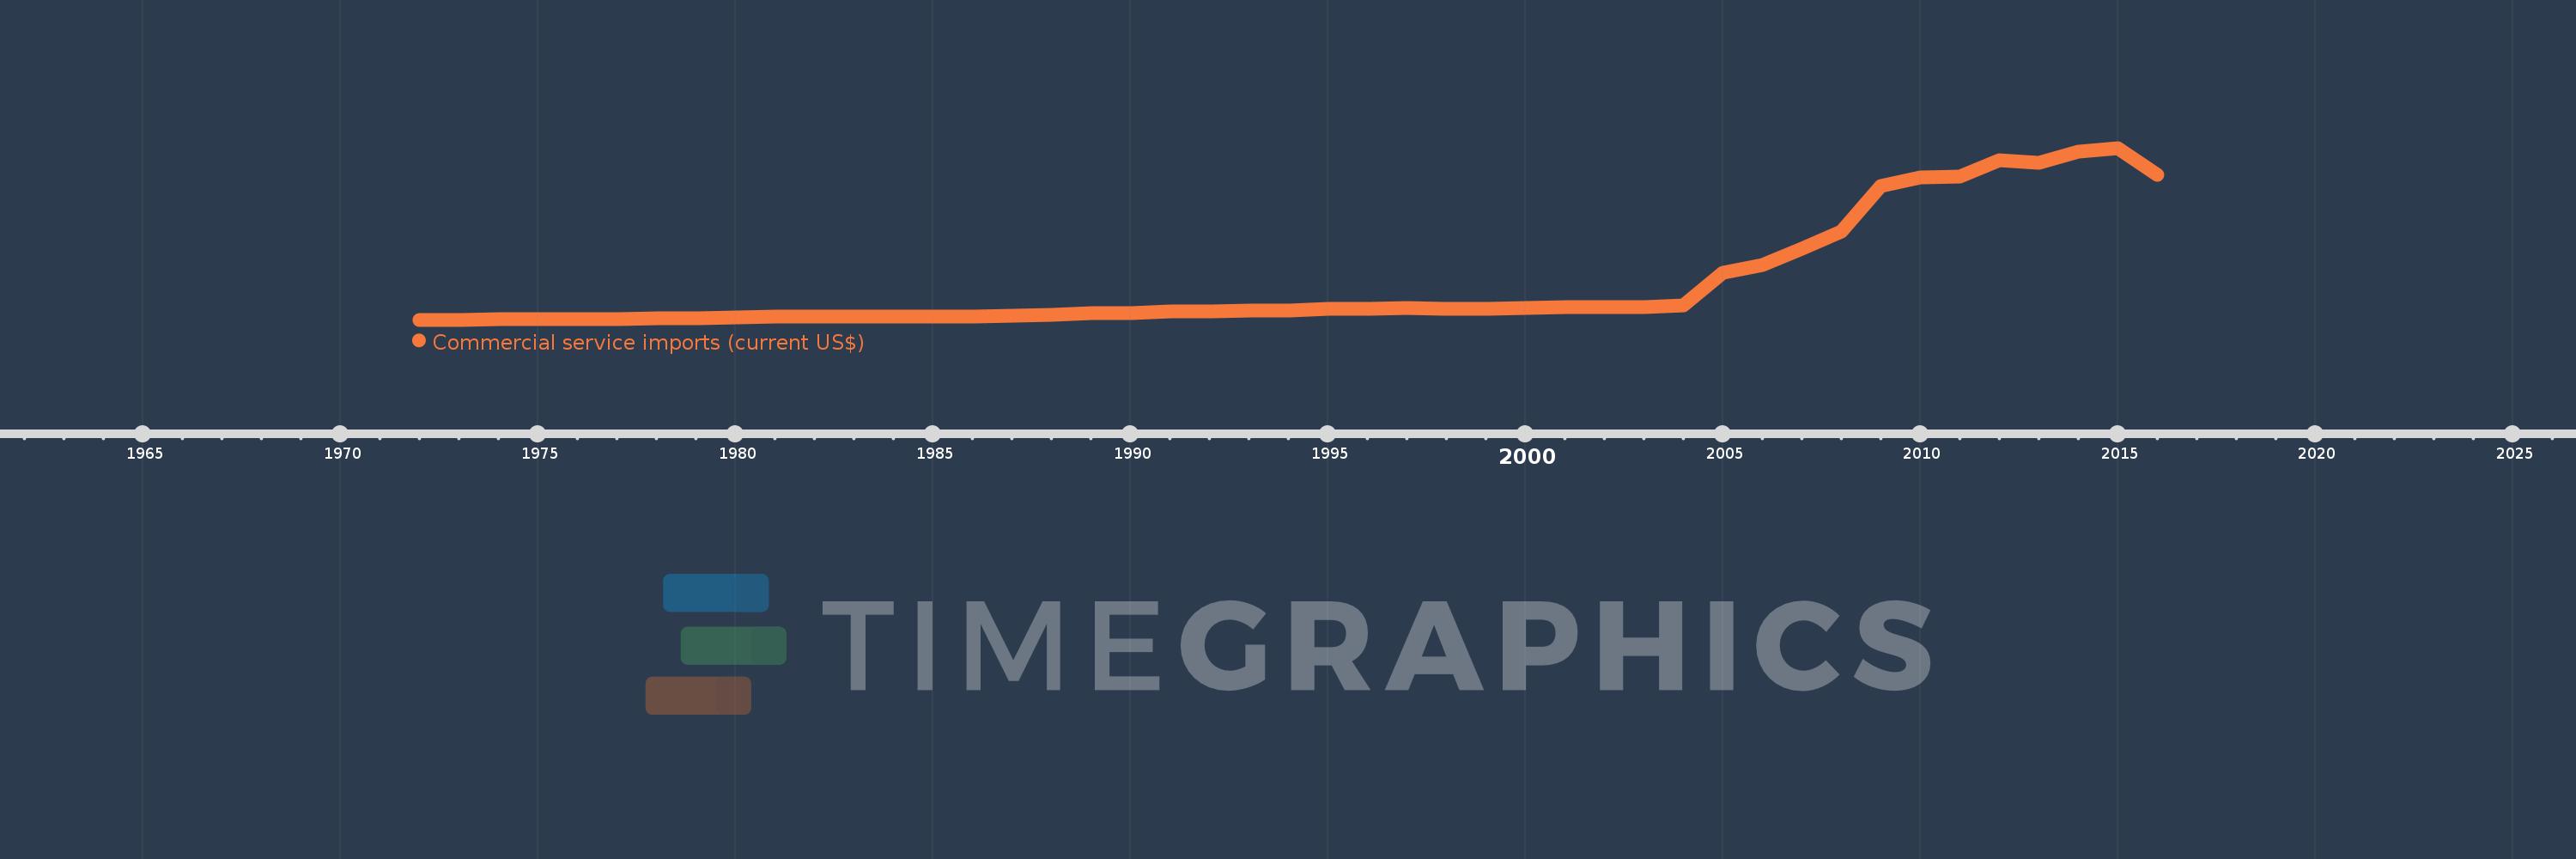
Commercial service imports (current US$)
2016,2015,2014,2013,2012,2011,2010,2009,2008,2007,2006,2005,2004,2003,2002,2001,2000,1999,1998,1997,1996,1995,1994,1993,1992,1991,1990,1989,1988,1987,1986,1985,1984,1983,1982,1981,1980,1979,1978,1977,1976,1975,1974,1973,1972
Diese Statistik in anderen Ländern:
AfghanistanAlbaniaAlgeriaAngolaAntigua and BarbudaArab WorldArgentinaArmeniaArubaAustraliaAustriaAzerbaijanBahamas, TheBahrainBangladeshBarbadosBelarusBelgiumBelizeBeninBermudaBhutanBoliviaBosnia and HerzegovinaBotswanaBrazilBrunei DarussalamBulgariaBurkina FasoBurundiCabo VerdeCambodiaCameroonCanadaCaribbean small statesCentral African RepublicCentral Europe and the BalticsChadChileChinaColombiaComorosCongo, Dem. Rep.Congo, Rep.Costa RicaCote d'IvoireCroatiaCuracaoCyprusCzech RepublicDenmarkDjiboutiDominicaDominican RepublicEarly-demographic dividendEast Asia & PacificEast Asia & Pacific (excluding high income)East Asia & Pacific (IDA & IBRD countries)EcuadorEgypt, Arab Rep.El SalvadorEquatorial GuineaEritreaEstoniaEthiopiaEuro areaEurope & Central AsiaEurope & Central Asia (excluding high income)Europe & Central Asia (IDA & IBRD countries)European UnionFaroe IslandsFijiFinlandFragile and conflict affected situationsFranceFrench PolynesiaGabonGambia, TheGeorgiaGermanyGhanaGreeceGrenadaGuatemalaGuineaGuinea-BissauGuyanaHaitiHeavily indebted poor countries (HIPC)High incomeHondurasHong Kong SAR, ChinaHungaryIBRD onlyIcelandIDA & IBRD totalIDA blendIDA onlyIDA totalIndiaIndonesiaIran, Islamic Rep.IraqIrelandIsraelItalyJamaicaJapanJordanKazakhstanKenyaKiribatiKorea, Rep.KosovoKuwaitKyrgyz RepublicLao PDRLate-demographic dividendLatin America & Caribbean Latin America & Caribbean (excluding high income)Latin America & the Caribbean (IDA & IBRD countries)LatviaLeast developed countries: UN classificationLebanonLesothoLiberiaLibyaLithuaniaLow & middle incomeLow incomeLower middle incomeLuxembourgMacao SAR, ChinaMacedonia, FYRMadagascarMalawiMalaysiaMaldivesMaliMaltaMarshall IslandsMauritaniaMauritiusMexicoMicronesia, Fed. Sts.Middle East & North Africa (excluding high income)Middle East & North Africa (IDA & IBRD countries)Middle incomeMoldovaMongoliaMontenegroMoroccoMozambiqueMyanmarNamibiaNepalNetherlandsNew CaledoniaNew ZealandNicaraguaNigerNigeriaNorth AmericaNorwayOECD membersOmanOther small statesPacific island small statesPakistanPalauPanamaPapua New GuineaParaguayPeruPhilippinesPolandPortugalPost-demographic dividendPre-demographic dividendQatarRomaniaRussian FederationRwandaSamoaSao Tome and PrincipeSaudi ArabiaSenegalSerbiaSeychellesSierra LeoneSingaporeSint Maarten (Dutch part)Slovak RepublicSloveniaSmall statesSolomon IslandsSouth AfricaSouth AsiaSouth Asia (IDA & IBRD)South SudanSpainSri LankaSt. Kitts and NevisSt. LuciaSt. Vincent and the GrenadinesSub-Saharan Africa Sub-Saharan Africa (excluding high income)Sub-Saharan Africa (IDA & IBRD countries)SudanSurinameSwazilandSwedenSwitzerlandSyrian Arab RepublicTajikistanTanzaniaThailandTimor-LesteTogoTongaTrinidad and TobagoTunisiaTurkeyTuvaluUgandaUkraineUnited KingdomUnited StatesUpper middle incomeUruguayVanuatuVenezuela, RBVietnamWest Bank and GazaWorldYemen, Rep.ZambiaZimbabwe Zeitlinie:
Diese Zeitleiste vorliegt die Graphik ab 1972 J. bis 2016 J. Malta. Die Angaben bis 1971 J. sind nicht vorhanden. Die Zahl aktueller Beobachtungen nach Daten: 45.
Die Quelle (Bezeichnung):
Kennzahlen der Weltentwicklung
Die Quelle (Einrichtung):
International Monetary Fund, Balance of Payments Statistics Yearbook and data files.
Kategorien:
Private Sector, Trade
Es wurde aktualisiert:
23 Apr 2017 Jahr
Kennzahlen der Wertänderungen vom Jahr zum Jahr
im Durchschnitt:
2.231 Mlrd.
Minimum:
40.284 Mln.
1 Jan 1972 Jahr
Maximum:
10.094 Mlrd.
1 Jan 2015 Jahr
Zum Datum der Beobachtung
Wert
Absolute Veränderung
Die Veränderung bezüglich dem vorherigen Wert
1 Jan 1972 Jahr
40.284 Mln.
+40.284 Mln.
0.0%
1 Jan 1973 Jahr
43.242 Mln.
+2.957 Mln.
7.34%
1 Jan 1974 Jahr
50.434 Mln.
+7.193 Mln.
16.63%
1 Jan 1975 Jahr
69.005 Mln.
+18.57 Mln.
36.82%
1 Jan 1976 Jahr
78.226 Mln.
+9.221 Mln.
13.36%
1 Jan 1977 Jahr
82.562 Mln.
+4.336 Mln.
5.54%
1 Jan 1978 Jahr
111.056 Mln.
+28.494 Mln.
34.51%
1 Jan 1979 Jahr
136.487 Mln.
+25.431 Mln.
22.9%
1 Jan 1980 Jahr
178.537 Mln.
+42.049 Mln.
30.81%
1 Jan 1981 Jahr
233.914 Mln.
+55.377 Mln.
31.02%
1 Jan 1982 Jahr
235.841 Mln.
+1.928 Mln.
0.82%
1 Jan 1983 Jahr
239.238 Mln.
+3.396 Mln.
1.44%
1 Jan 1984 Jahr
202.567 Mln.
-36.67 Mln.
-15.33%
1 Jan 1985 Jahr
205.191 Mln.
+2.624 Mln.
1.3%
1 Jan 1986 Jahr
211.444 Mln.
+6.253 Mln.
3.05%
1 Jan 1987 Jahr
272.779 Mln.
+61.335 Mln.
29.01%
1 Jan 1988 Jahr
349.647 Mln.
+76.868 Mln.
28.18%
1 Jan 1989 Jahr
402.289 Mln.
+52.642 Mln.
15.06%
1 Jan 1990 Jahr
416.652 Mln.
+14.363 Mln.
3.57%
1 Jan 1991 Jahr
504.937 Mln.
+88.286 Mln.
21.19%
1 Jan 1992 Jahr
509.791 Mln.
+4.853 Mln.
0.96%
1 Jan 1993 Jahr
573.934 Mln.
+64.144 Mln.
12.58%
1 Jan 1994 Jahr
598.45 Mln.
+24.516 Mln.
4.27%
1 Jan 1995 Jahr
677.446 Mln.
+78.996 Mln.
13.2%
1 Jan 1996 Jahr
701.687 Mln.
+24.242 Mln.
3.58%
1 Jan 1997 Jahr
708.269 Mln.
+6.582 Mln.
0.94%
1 Jan 1998 Jahr
659.741 Mln.
-48.528 Mln.
-6.85%
1 Jan 1999 Jahr
696.322 Mln.
+36.581 Mln.
5.54%
1 Jan 2000 Jahr
741.475 Mln.
+45.153 Mln.
6.48%
1 Jan 2001 Jahr
755.911 Mln.
+14.436 Mln.
1.95%
1 Jan 2002 Jahr
759.362 Mln.
+3.451 Mln.
0.46%
1 Jan 2003 Jahr
794.655 Mln.
+35.292 Mln.
4.65%
1 Jan 2004 Jahr
883.963 Mln.
+89.309 Mln.
11.24%
1 Jan 2005 Jahr
2.814 Mlrd.
+1.93 Mlrd.
218.33%
1 Jan 2006 Jahr
3.247 Mlrd.
+432.777 Mln.
15.38%
1 Jan 2007 Jahr
4.215 Mlrd.
+967.893 Mln.
29.81%
1 Jan 2008 Jahr
5.199 Mlrd.
+984.417 Mln.
23.36%
1 Jan 2009 Jahr
7.89 Mlrd.
+2.691 Mlrd.
51.76%
1 Jan 2010 Jahr
8.389 Mlrd.
+498.767 Mln.
6.32%
1 Jan 2011 Jahr
8.436 Mlrd.
+47.096 Mln.
0.56%
1 Jan 2012 Jahr
9.358 Mlrd.
+922.361 Mln.
10.93%
1 Jan 2013 Jahr
9.243 Mlrd.
-115.186 Mln.
-1.23%
1 Jan 2014 Jahr
9.855 Mlrd.
+611.461 Mln.
6.62%
1 Jan 2015 Jahr
10.094 Mlrd.
+238.811 Mln.
2.42%
1 Jan 2016 Jahr
8.512 Mlrd.
-1.581 Mlrd.
-15.66%
Bewertung der Länder gemäß mit laufender Statistik nach Jahren


Kommentare: