29
/de/
de
AIzaSyAYiBZKx7MnpbEhh9jyipgxe19OcubqV5w
April 1, 2024
155298
India
IND
true
2
1
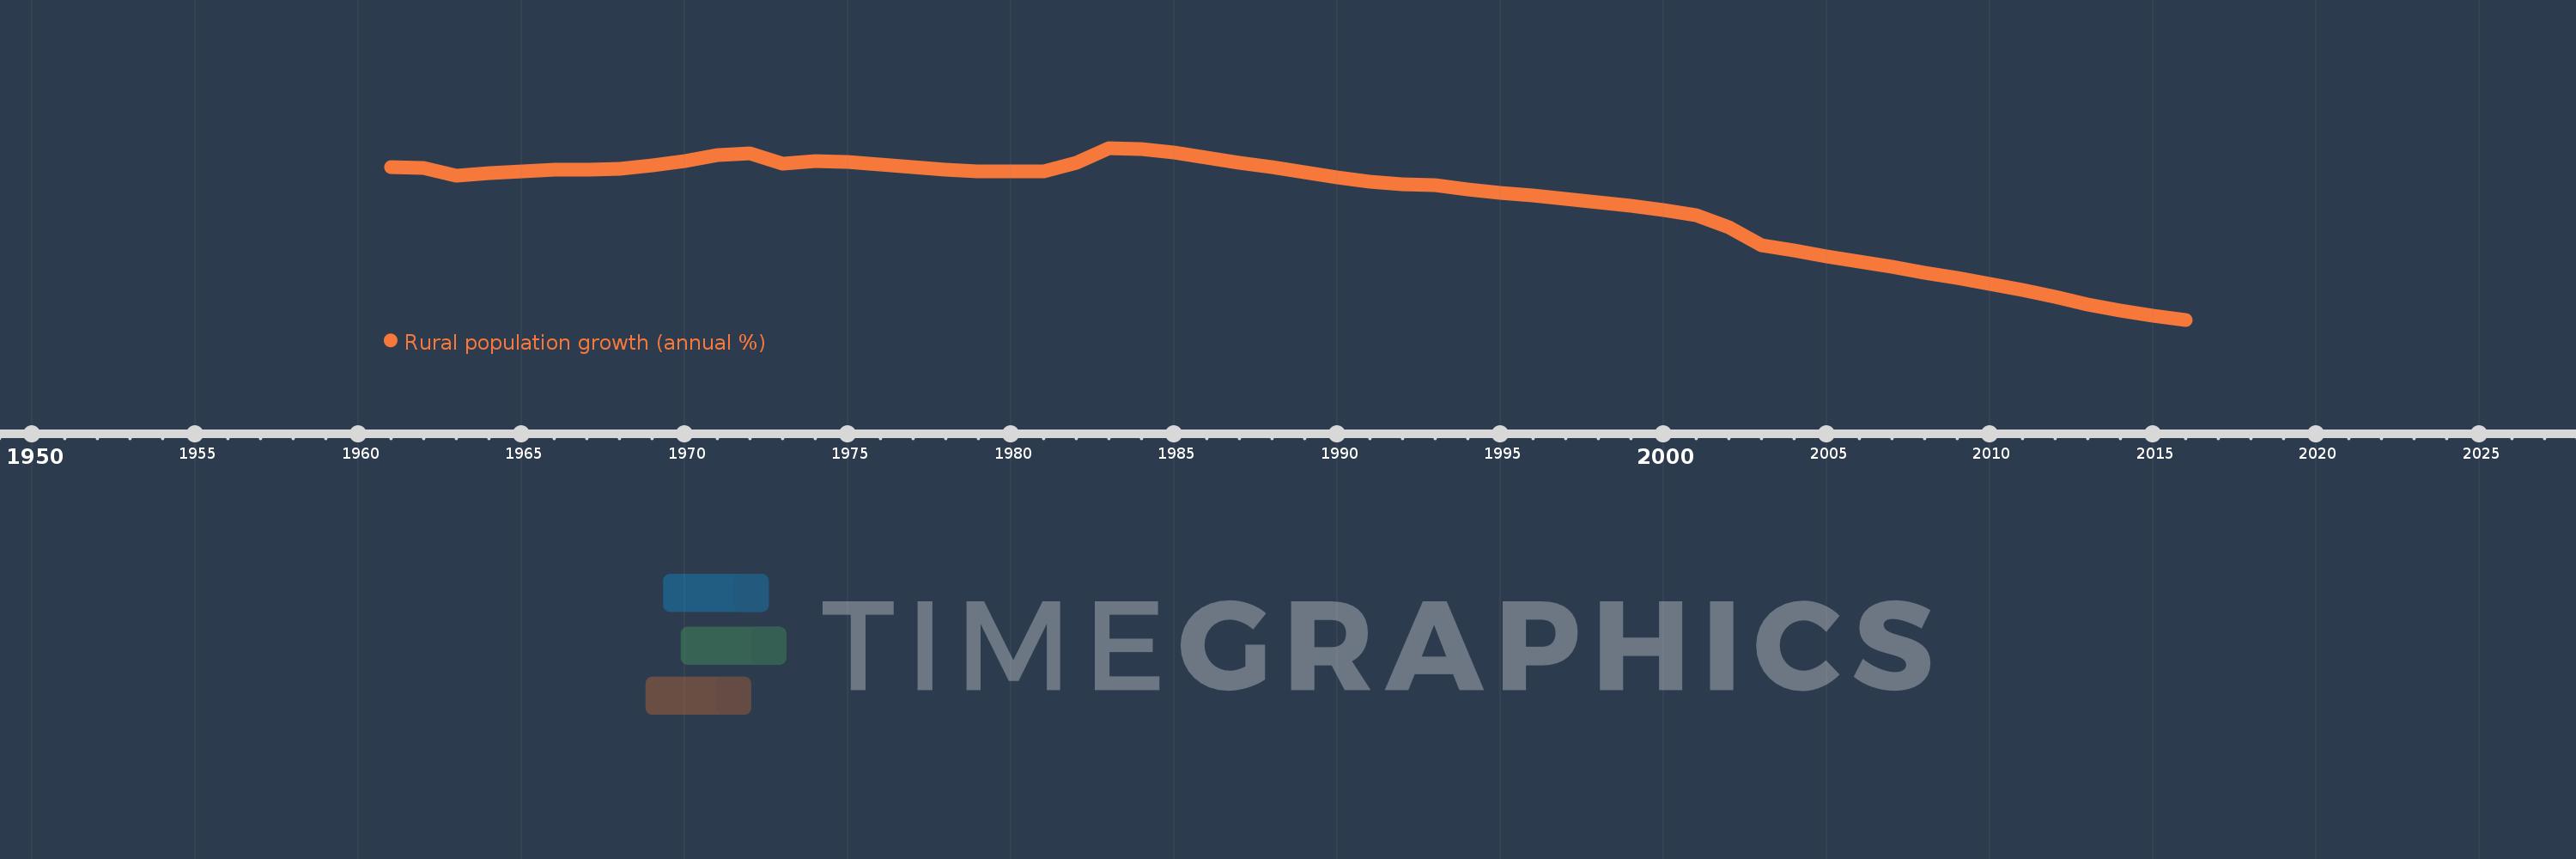
Rural population growth (annual %)
2016,2015,2014,2013,2012,2011,2010,2009,2008,2007,2006,2005,2004,2003,2002,2001,2000,1999,1998,1997,1996,1995,1994,1993,1992,1991,1990,1989,1988,1987,1986,1985,1984,1983,1982,1981,1980,1979,1978,1977,1976,1975,1974,1973,1972,1971,1970,1969,1968,1967,1966,1965,1964,1963,1962,1961
Diese Statistik in anderen Ländern:
AfghanistanAlbaniaAlgeriaAmerican SamoaAndorraAngolaAntigua and BarbudaArab WorldArgentinaArmeniaArubaAustraliaAustriaAzerbaijanBahamas, TheBahrainBangladeshBarbadosBelarusBelgiumBelizeBeninBhutanBoliviaBosnia and HerzegovinaBotswanaBrazilBritish Virgin IslandsBrunei DarussalamBulgariaBurkina FasoBurundiCabo VerdeCambodiaCameroonCanadaCaribbean small statesCentral African RepublicCentral Europe and the BalticsChadChannel IslandsChileChinaColombiaComorosCongo, Dem. Rep.Congo, Rep.Costa RicaCote d'IvoireCroatiaCubaCuracaoCyprusCzech RepublicDenmarkDjiboutiDominicaDominican RepublicEarly-demographic dividendEast Asia & PacificEast Asia & Pacific (excluding high income)East Asia & Pacific (IDA & IBRD countries)EcuadorEgypt, Arab Rep.El SalvadorEquatorial GuineaEritreaEstoniaEthiopiaEuro areaEurope & Central AsiaEurope & Central Asia (excluding high income)Europe & Central Asia (IDA & IBRD countries)European UnionFaroe IslandsFijiFinlandFragile and conflict affected situationsFranceFrench PolynesiaGabonGambia, TheGeorgiaGermanyGhanaGreeceGreenlandGrenadaGuamGuatemalaGuineaGuinea-BissauGuyanaHaitiHeavily indebted poor countries (HIPC)High incomeHondurasHong Kong SAR, ChinaHungaryIBRD onlyIcelandIDA & IBRD totalIDA blendIDA onlyIDA totalIndiaIndonesiaIran, Islamic Rep.IraqIrelandIsle of ManIsraelItalyJamaicaJapanJordanKazakhstanKenyaKiribatiKorea, Dem. People’s Rep.Korea, Rep.KuwaitKyrgyz RepublicLao PDRLate-demographic dividendLatin America & Caribbean Latin America & Caribbean (excluding high income)Latin America & the Caribbean (IDA & IBRD countries)LatviaLeast developed countries: UN classificationLebanonLesothoLiberiaLibyaLiechtensteinLithuaniaLow & middle incomeLow incomeLower middle incomeLuxembourgMacao SAR, ChinaMacedonia, FYRMadagascarMalawiMalaysiaMaldivesMaliMaltaMarshall IslandsMauritaniaMauritiusMexicoMicronesia, Fed. Sts.Middle East & North AfricaMiddle East & North Africa (excluding high income)Middle East & North Africa (IDA & IBRD countries)Middle incomeMoldovaMongoliaMontenegroMoroccoMozambiqueMyanmarNamibiaNauruNepalNetherlandsNew CaledoniaNew ZealandNicaraguaNigerNigeriaNorth AmericaNorthern Mariana IslandsNorwayOECD membersOmanOther small statesPacific island small statesPakistanPalauPanamaPapua New GuineaParaguayPeruPhilippinesPolandPortugalPost-demographic dividendPre-demographic dividendPuerto RicoQatarRomaniaRussian FederationRwandaSamoaSan MarinoSao Tome and PrincipeSaudi ArabiaSenegalSerbiaSeychellesSierra LeoneSlovak RepublicSloveniaSmall statesSolomon IslandsSomaliaSouth AfricaSouth AsiaSouth Asia (IDA & IBRD)South SudanSpainSri LankaSt. Kitts and NevisSt. LuciaSt. Vincent and the GrenadinesSub-Saharan Africa Sub-Saharan Africa (excluding high income)Sub-Saharan Africa (IDA & IBRD countries)SudanSurinameSwazilandSwedenSwitzerlandSyrian Arab RepublicTajikistanTanzaniaThailandTimor-LesteTogoTongaTrinidad and TobagoTunisiaTurkeyTurkmenistanTurks and Caicos IslandsTuvaluUgandaUkraineUnited Arab EmiratesUnited KingdomUnited StatesUpper middle incomeUruguayUzbekistanVanuatuVenezuela, RBVietnamVirgin Islands (U.S.)West Bank and GazaWorldYemen, Rep.ZambiaZimbabwe Zeitlinie:
Diese Zeitleiste vorliegt die Graphik ab 1961 J. bis 2016 J. India. Die Angaben bis 1960 J. sind nicht vorhanden. Die Zahl aktueller Beobachtungen nach Daten: 56.
Die Quelle (Bezeichnung):
Kennzahlen der Weltentwicklung
Die Quelle (Einrichtung):
World Bank Staff estimates based on United Nations, World Urbanization Prospects.
Kategorien:
Agriculture & Rural Development
Es wurde aktualisiert:
23 Apr 2017 Jahr
Kennzahlen der Wertänderungen vom Jahr zum Jahr
Minimum:
0.644
1 Jan 2016 Jahr
Maximum:
2.018
1 Jan 1983 Jahr
Zum Datum der Beobachtung
Wert
Absolute Veränderung
Die Veränderung bezüglich dem vorherigen Wert
1 Jan 1961 Jahr
1.868
+1.868
0.0%
1 Jan 1962 Jahr
1.857
-0.012
-0.62%
1 Jan 1963 Jahr
1.793
-0.063
-3.4%
1 Jan 1964 Jahr
1.817
+0.024
1.33%
1 Jan 1965 Jahr
1.83
+0.013
0.72%
1 Jan 1966 Jahr
1.842
+0.012
0.65%
1 Jan 1967 Jahr
1.847
+0.004
0.24%
1 Jan 1968 Jahr
1.854
+0.008
0.42%
1 Jan 1969 Jahr
1.876
+0.022
1.18%
1 Jan 1970 Jahr
1.915
+0.039
2.06%
1 Jan 1971 Jahr
1.962
+0.047
2.44%
1 Jan 1972 Jahr
1.972
+0.01
0.51%
1 Jan 1973 Jahr
1.889
-0.083
-4.21%
1 Jan 1974 Jahr
1.91
+0.021
1.1%
1 Jan 1975 Jahr
1.904
-0.006
-0.3%
1 Jan 1976 Jahr
1.887
-0.017
-0.87%
1 Jan 1977 Jahr
1.863
-0.025
-1.31%
1 Jan 1978 Jahr
1.842
-0.021
-1.14%
1 Jan 1979 Jahr
1.829
-0.013
-0.69%
1 Jan 1980 Jahr
1.828
0.0
-0.03%
1 Jan 1981 Jahr
1.833
+0.005
0.25%
1 Jan 1982 Jahr
1.9
+0.067
3.64%
1 Jan 1983 Jahr
2.018
+0.119
6.25%
1 Jan 1984 Jahr
2.006
-0.012
-0.6%
1 Jan 1985 Jahr
1.979
-0.027
-1.36%
1 Jan 1986 Jahr
1.943
-0.037
-1.85%
1 Jan 1987 Jahr
1.902
-0.041
-2.09%
1 Jan 1988 Jahr
1.864
-0.038
-1.99%
1 Jan 1989 Jahr
1.824
-0.04
-2.13%
1 Jan 1990 Jahr
1.785
-0.039
-2.16%
1 Jan 1991 Jahr
1.749
-0.036
-2.02%
1 Jan 1992 Jahr
1.726
-0.023
-1.32%
1 Jan 1993 Jahr
1.722
-0.004
-0.23%
1 Jan 1994 Jahr
1.688
-0.034
-1.98%
1 Jan 1995 Jahr
1.66
-0.028
-1.66%
1 Jan 1996 Jahr
1.637
-0.023
-1.39%
1 Jan 1997 Jahr
1.612
-0.025
-1.52%
1 Jan 1998 Jahr
1.585
-0.026
-1.64%
1 Jan 1999 Jahr
1.555
-0.031
-1.95%
1 Jan 2000 Jahr
1.518
-0.037
-2.37%
1 Jan 2001 Jahr
1.477
-0.041
-2.7%
1 Jan 2002 Jahr
1.385
-0.092
-6.24%
1 Jan 2003 Jahr
1.24
-0.145
-10.46%
1 Jan 2004 Jahr
1.196
-0.044
-3.55%
1 Jan 2005 Jahr
1.151
-0.045
-3.75%
1 Jan 2006 Jahr
1.109
-0.042
-3.63%
1 Jan 2007 Jahr
1.067
-0.042
-3.79%
1 Jan 2008 Jahr
1.023
-0.044
-4.11%
1 Jan 2009 Jahr
0.977
-0.047
-4.56%
1 Jan 2010 Jahr
0.929
-0.047
-4.85%
1 Jan 2011 Jahr
0.879
-0.05
-5.42%
1 Jan 2012 Jahr
0.826
-0.053
-6.0%
1 Jan 2013 Jahr
0.768
-0.058
-7.05%
1 Jan 2014 Jahr
0.719
-0.049
-6.39%
1 Jan 2015 Jahr
0.678
-0.041
-5.65%
1 Jan 2016 Jahr
0.644
-0.034
-4.99%
Bewertung der Länder gemäß mit laufender Statistik nach Jahren


Kommentare: