29
/de/
de
AIzaSyAYiBZKx7MnpbEhh9jyipgxe19OcubqV5w
April 1, 2024
109077
Comoros
COM
true
2
1
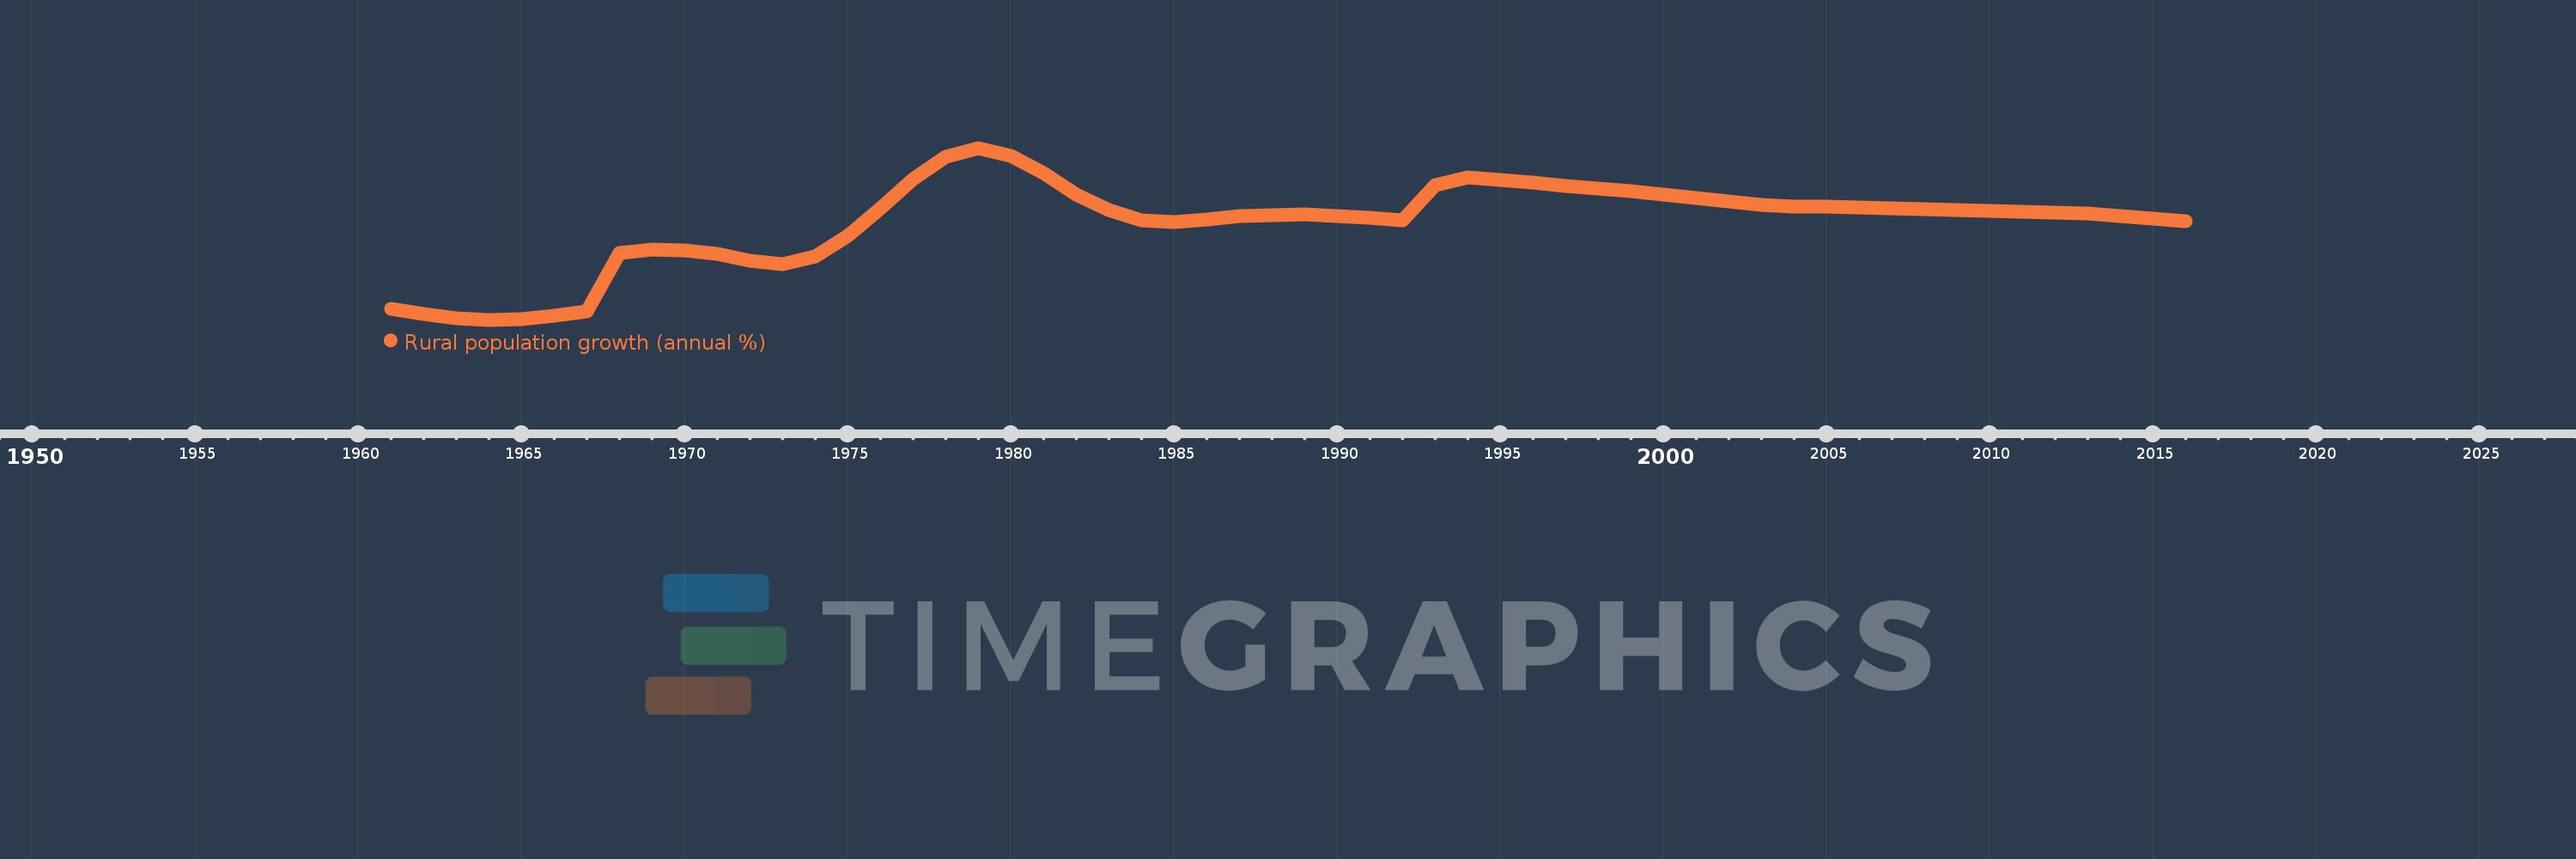
Rural population growth (annual %)
2016,2015,2014,2013,2012,2011,2010,2009,2008,2007,2006,2005,2004,2003,2002,2001,2000,1999,1998,1997,1996,1995,1994,1993,1992,1991,1990,1989,1988,1987,1986,1985,1984,1983,1982,1981,1980,1979,1978,1977,1976,1975,1974,1973,1972,1971,1970,1969,1968,1967,1966,1965,1964,1963,1962,1961
Diese Statistik in anderen Ländern:
AfghanistanAlbaniaAlgeriaAmerican SamoaAndorraAngolaAntigua and BarbudaArab WorldArgentinaArmeniaArubaAustraliaAustriaAzerbaijanBahamas, TheBahrainBangladeshBarbadosBelarusBelgiumBelizeBeninBhutanBoliviaBosnia and HerzegovinaBotswanaBrazilBritish Virgin IslandsBrunei DarussalamBulgariaBurkina FasoBurundiCabo VerdeCambodiaCameroonCanadaCaribbean small statesCentral African RepublicCentral Europe and the BalticsChadChannel IslandsChileChinaColombiaComorosCongo, Dem. Rep.Congo, Rep.Costa RicaCote d'IvoireCroatiaCubaCuracaoCyprusCzech RepublicDenmarkDjiboutiDominicaDominican RepublicEarly-demographic dividendEast Asia & PacificEast Asia & Pacific (excluding high income)East Asia & Pacific (IDA & IBRD countries)EcuadorEgypt, Arab Rep.El SalvadorEquatorial GuineaEritreaEstoniaEthiopiaEuro areaEurope & Central AsiaEurope & Central Asia (excluding high income)Europe & Central Asia (IDA & IBRD countries)European UnionFaroe IslandsFijiFinlandFragile and conflict affected situationsFranceFrench PolynesiaGabonGambia, TheGeorgiaGermanyGhanaGreeceGreenlandGrenadaGuamGuatemalaGuineaGuinea-BissauGuyanaHaitiHeavily indebted poor countries (HIPC)High incomeHondurasHong Kong SAR, ChinaHungaryIBRD onlyIcelandIDA & IBRD totalIDA blendIDA onlyIDA totalIndiaIndonesiaIran, Islamic Rep.IraqIrelandIsle of ManIsraelItalyJamaicaJapanJordanKazakhstanKenyaKiribatiKorea, Dem. People’s Rep.Korea, Rep.KuwaitKyrgyz RepublicLao PDRLate-demographic dividendLatin America & Caribbean Latin America & Caribbean (excluding high income)Latin America & the Caribbean (IDA & IBRD countries)LatviaLeast developed countries: UN classificationLebanonLesothoLiberiaLibyaLiechtensteinLithuaniaLow & middle incomeLow incomeLower middle incomeLuxembourgMacao SAR, ChinaMacedonia, FYRMadagascarMalawiMalaysiaMaldivesMaliMaltaMarshall IslandsMauritaniaMauritiusMexicoMicronesia, Fed. Sts.Middle East & North AfricaMiddle East & North Africa (excluding high income)Middle East & North Africa (IDA & IBRD countries)Middle incomeMoldovaMongoliaMontenegroMoroccoMozambiqueMyanmarNamibiaNauruNepalNetherlandsNew CaledoniaNew ZealandNicaraguaNigerNigeriaNorth AmericaNorthern Mariana IslandsNorwayOECD membersOmanOther small statesPacific island small statesPakistanPalauPanamaPapua New GuineaParaguayPeruPhilippinesPolandPortugalPost-demographic dividendPre-demographic dividendPuerto RicoQatarRomaniaRussian FederationRwandaSamoaSan MarinoSao Tome and PrincipeSaudi ArabiaSenegalSerbiaSeychellesSierra LeoneSlovak RepublicSloveniaSmall statesSolomon IslandsSomaliaSouth AfricaSouth AsiaSouth Asia (IDA & IBRD)South SudanSpainSri LankaSt. Kitts and NevisSt. LuciaSt. Vincent and the GrenadinesSub-Saharan Africa Sub-Saharan Africa (excluding high income)Sub-Saharan Africa (IDA & IBRD countries)SudanSurinameSwazilandSwedenSwitzerlandSyrian Arab RepublicTajikistanTanzaniaThailandTimor-LesteTogoTongaTrinidad and TobagoTunisiaTurkeyTurkmenistanTurks and Caicos IslandsTuvaluUgandaUkraineUnited Arab EmiratesUnited KingdomUnited StatesUpper middle incomeUruguayUzbekistanVanuatuVenezuela, RBVietnamVirgin Islands (U.S.)West Bank and GazaWorldYemen, Rep.ZambiaZimbabwe Zeitlinie:
Diese Zeitleiste vorliegt die Graphik ab 1961 J. bis 2016 J. Comoros. Die Angaben bis 1960 J. sind nicht vorhanden. Die Zahl aktueller Beobachtungen nach Daten: 56.
Die Quelle (Bezeichnung):
Kennzahlen der Weltentwicklung
Die Quelle (Einrichtung):
World Bank Staff estimates based on United Nations, World Urbanization Prospects.
Kategorien:
Agriculture & Rural Development
Es wurde aktualisiert:
23 Apr 2017 Jahr
Kennzahlen der Wertänderungen vom Jahr zum Jahr
Minimum:
0.614
1 Jan 1964 Jahr
Maximum:
3.437
1 Jan 1979 Jahr
Zum Datum der Beobachtung
Wert
Absolute Veränderung
Die Veränderung bezüglich dem vorherigen Wert
1 Jan 1961 Jahr
0.794
+0.794
0.0%
1 Jan 1962 Jahr
0.712
-0.083
-10.4%
1 Jan 1963 Jahr
0.644
-0.068
-9.52%
1 Jan 1964 Jahr
0.614
-0.03
-4.61%
1 Jan 1965 Jahr
0.63
+0.015
2.46%
1 Jan 1966 Jahr
0.674
+0.045
7.11%
1 Jan 1967 Jahr
0.75
+0.075
11.16%
1 Jan 1968 Jahr
1.71
+0.96
128.12%
1 Jan 1969 Jahr
1.774
+0.065
3.78%
1 Jan 1970 Jahr
1.754
-0.02
-1.12%
1 Jan 1971 Jahr
1.691
-0.064
-3.64%
1 Jan 1972 Jahr
1.581
-0.109
-6.47%
1 Jan 1973 Jahr
1.528
-0.053
-3.35%
1 Jan 1974 Jahr
1.65
+0.122
7.95%
1 Jan 1975 Jahr
1.987
+0.337
20.42%
1 Jan 1976 Jahr
2.444
+0.457
23.0%
1 Jan 1977 Jahr
2.931
+0.488
19.96%
1 Jan 1978 Jahr
3.298
+0.367
12.53%
1 Jan 1979 Jahr
3.437
+0.138
4.19%
1 Jan 1980 Jahr
3.311
-0.126
-3.66%
1 Jan 1981 Jahr
3.022
-0.289
-8.73%
1 Jan 1982 Jahr
2.667
-0.355
-11.74%
1 Jan 1983 Jahr
2.412
-0.255
-9.57%
1 Jan 1984 Jahr
2.253
-0.159
-6.58%
1 Jan 1985 Jahr
2.22
-0.033
-1.45%
1 Jan 1986 Jahr
2.268
+0.048
2.15%
1 Jan 1987 Jahr
2.32
+0.052
2.28%
1 Jan 1988 Jahr
2.337
+0.017
0.74%
1 Jan 1989 Jahr
2.342
+0.005
0.2%
1 Jan 1990 Jahr
2.324
-0.018
-0.76%
1 Jan 1991 Jahr
2.29
-0.034
-1.47%
1 Jan 1992 Jahr
2.254
-0.036
-1.55%
1 Jan 1993 Jahr
2.83
+0.576
25.53%
1 Jan 1994 Jahr
2.959
+0.129
4.56%
1 Jan 1995 Jahr
2.916
-0.043
-1.47%
1 Jan 1996 Jahr
2.868
-0.048
-1.64%
1 Jan 1997 Jahr
2.818
-0.05
-1.73%
1 Jan 1998 Jahr
2.772
-0.046
-1.64%
1 Jan 1999 Jahr
2.723
-0.049
-1.77%
1 Jan 2000 Jahr
2.666
-0.057
-2.09%
1 Jan 2001 Jahr
2.611
-0.055
-2.07%
1 Jan 2002 Jahr
2.555
-0.056
-2.15%
1 Jan 2003 Jahr
2.507
-0.048
-1.88%
1 Jan 2004 Jahr
2.478
-0.028
-1.13%
1 Jan 2005 Jahr
2.469
-0.009
-0.37%
1 Jan 2006 Jahr
2.457
-0.012
-0.49%
1 Jan 2007 Jahr
2.449
-0.008
-0.32%
1 Jan 2008 Jahr
2.435
-0.014
-0.57%
1 Jan 2009 Jahr
2.423
-0.012
-0.5%
1 Jan 2010 Jahr
2.409
-0.014
-0.59%
1 Jan 2011 Jahr
2.391
-0.018
-0.73%
1 Jan 2012 Jahr
2.376
-0.015
-0.63%
1 Jan 2013 Jahr
2.353
-0.023
-0.97%
1 Jan 2014 Jahr
2.324
-0.029
-1.22%
1 Jan 2015 Jahr
2.281
-0.044
-1.88%
1 Jan 2016 Jahr
2.229
-0.052
-2.28%
Bewertung der Länder gemäß mit laufender Statistik nach Jahren


Kommentare: