29
/de/
de
AIzaSyAYiBZKx7MnpbEhh9jyipgxe19OcubqV5w
April 1, 2024
105425
Chile
CHL
true
2
1
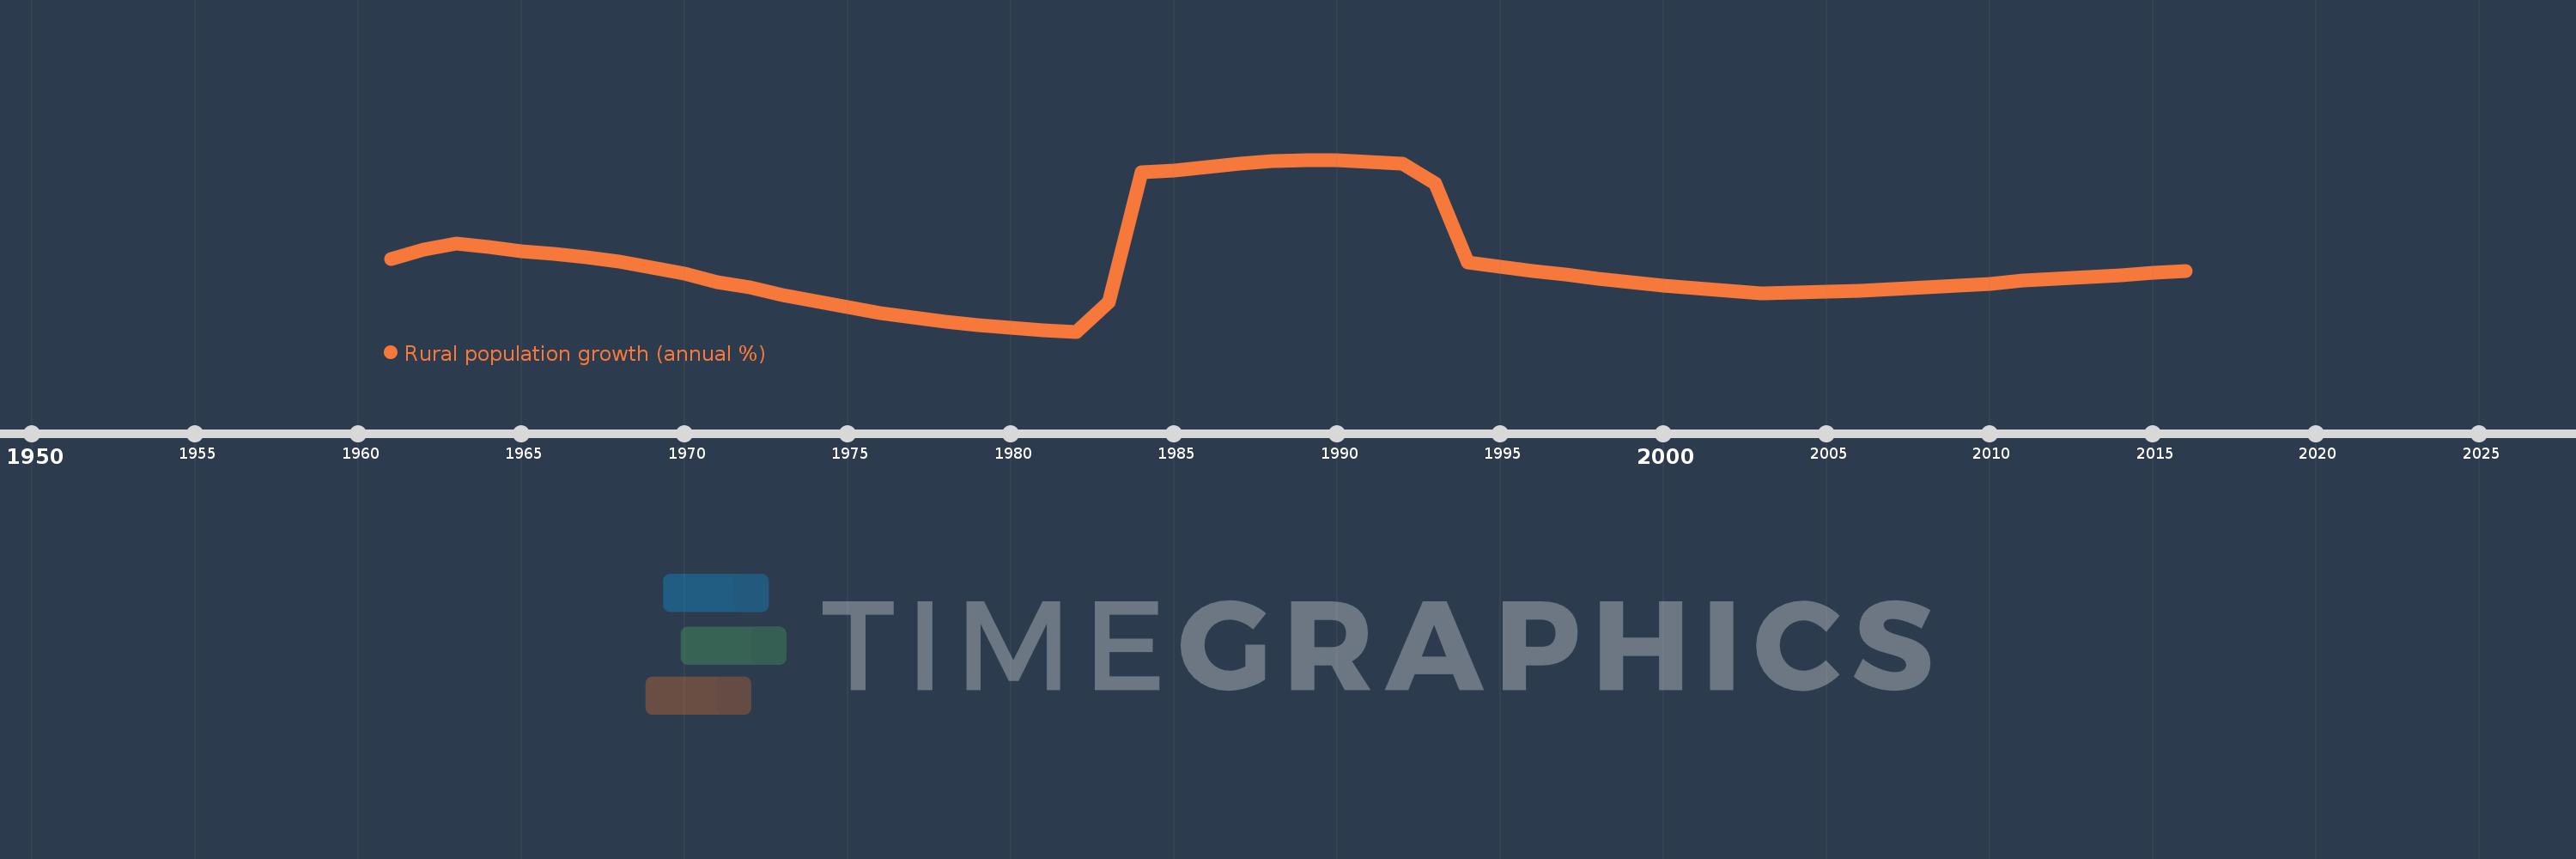
Rural population growth (annual %)
2016,2015,2014,2013,2012,2011,2010,2009,2008,2007,2006,2005,2004,2003,2002,2001,2000,1999,1998,1997,1996,1995,1994,1993,1992,1991,1990,1989,1988,1987,1986,1985,1984,1983,1982,1981,1980,1979,1978,1977,1976,1975,1974,1973,1972,1971,1970,1969,1968,1967,1966,1965,1964,1963,1962,1961
Diese Statistik in anderen Ländern:
AfghanistanAlbaniaAlgeriaAmerican SamoaAndorraAngolaAntigua and BarbudaArab WorldArgentinaArmeniaArubaAustraliaAustriaAzerbaijanBahamas, TheBahrainBangladeshBarbadosBelarusBelgiumBelizeBeninBhutanBoliviaBosnia and HerzegovinaBotswanaBrazilBritish Virgin IslandsBrunei DarussalamBulgariaBurkina FasoBurundiCabo VerdeCambodiaCameroonCanadaCaribbean small statesCentral African RepublicCentral Europe and the BalticsChadChannel IslandsChileChinaColombiaComorosCongo, Dem. Rep.Congo, Rep.Costa RicaCote d'IvoireCroatiaCubaCuracaoCyprusCzech RepublicDenmarkDjiboutiDominicaDominican RepublicEarly-demographic dividendEast Asia & PacificEast Asia & Pacific (excluding high income)East Asia & Pacific (IDA & IBRD countries)EcuadorEgypt, Arab Rep.El SalvadorEquatorial GuineaEritreaEstoniaEthiopiaEuro areaEurope & Central AsiaEurope & Central Asia (excluding high income)Europe & Central Asia (IDA & IBRD countries)European UnionFaroe IslandsFijiFinlandFragile and conflict affected situationsFranceFrench PolynesiaGabonGambia, TheGeorgiaGermanyGhanaGreeceGreenlandGrenadaGuamGuatemalaGuineaGuinea-BissauGuyanaHaitiHeavily indebted poor countries (HIPC)High incomeHondurasHong Kong SAR, ChinaHungaryIBRD onlyIcelandIDA & IBRD totalIDA blendIDA onlyIDA totalIndiaIndonesiaIran, Islamic Rep.IraqIrelandIsle of ManIsraelItalyJamaicaJapanJordanKazakhstanKenyaKiribatiKorea, Dem. People’s Rep.Korea, Rep.KuwaitKyrgyz RepublicLao PDRLate-demographic dividendLatin America & Caribbean Latin America & Caribbean (excluding high income)Latin America & the Caribbean (IDA & IBRD countries)LatviaLeast developed countries: UN classificationLebanonLesothoLiberiaLibyaLiechtensteinLithuaniaLow & middle incomeLow incomeLower middle incomeLuxembourgMacao SAR, ChinaMacedonia, FYRMadagascarMalawiMalaysiaMaldivesMaliMaltaMarshall IslandsMauritaniaMauritiusMexicoMicronesia, Fed. Sts.Middle East & North AfricaMiddle East & North Africa (excluding high income)Middle East & North Africa (IDA & IBRD countries)Middle incomeMoldovaMongoliaMontenegroMoroccoMozambiqueMyanmarNamibiaNauruNepalNetherlandsNew CaledoniaNew ZealandNicaraguaNigerNigeriaNorth AmericaNorthern Mariana IslandsNorwayOECD membersOmanOther small statesPacific island small statesPakistanPalauPanamaPapua New GuineaParaguayPeruPhilippinesPolandPortugalPost-demographic dividendPre-demographic dividendPuerto RicoQatarRomaniaRussian FederationRwandaSamoaSan MarinoSao Tome and PrincipeSaudi ArabiaSenegalSerbiaSeychellesSierra LeoneSlovak RepublicSloveniaSmall statesSolomon IslandsSomaliaSouth AfricaSouth AsiaSouth Asia (IDA & IBRD)South SudanSpainSri LankaSt. Kitts and NevisSt. LuciaSt. Vincent and the GrenadinesSub-Saharan Africa Sub-Saharan Africa (excluding high income)Sub-Saharan Africa (IDA & IBRD countries)SudanSurinameSwazilandSwedenSwitzerlandSyrian Arab RepublicTajikistanTanzaniaThailandTimor-LesteTogoTongaTrinidad and TobagoTunisiaTurkeyTurkmenistanTurks and Caicos IslandsTuvaluUgandaUkraineUnited Arab EmiratesUnited KingdomUnited StatesUpper middle incomeUruguayUzbekistanVanuatuVenezuela, RBVietnamVirgin Islands (U.S.)West Bank and GazaWorldYemen, Rep.ZambiaZimbabwe Zeitlinie:
Diese Zeitleiste vorliegt die Graphik ab 1961 J. bis 2016 J. Chile. Die Angaben bis 1960 J. sind nicht vorhanden. Die Zahl aktueller Beobachtungen nach Daten: 56.
Die Quelle (Bezeichnung):
Kennzahlen der Weltentwicklung
Die Quelle (Einrichtung):
World Bank Staff estimates based on United Nations, World Urbanization Prospects.
Kategorien:
Agriculture & Rural Development
Es wurde aktualisiert:
23 Apr 2017 Jahr
Kennzahlen der Wertänderungen vom Jahr zum Jahr
Minimum:
-1.426
1 Jan 1982 Jahr
Maximum:
0.901
1 Jan 1989 Jahr
Zum Datum der Beobachtung
Wert
Absolute Veränderung
Die Veränderung bezüglich dem vorherigen Wert
1 Jan 1961 Jahr
-0.446
-0.446
0.0%
1 Jan 1962 Jahr
-0.311
+0.135
-30.21%
1 Jan 1963 Jahr
-0.235
+0.076
-24.33%
1 Jan 1964 Jahr
-0.283
-0.048
20.4%
1 Jan 1965 Jahr
-0.333
-0.049
17.4%
1 Jan 1966 Jahr
-0.372
-0.039
11.75%
1 Jan 1967 Jahr
-0.425
-0.053
14.25%
1 Jan 1968 Jahr
-0.479
-0.055
12.84%
1 Jan 1969 Jahr
-0.558
-0.079
16.42%
1 Jan 1970 Jahr
-0.646
-0.088
15.73%
1 Jan 1971 Jahr
-0.756
-0.11
17.04%
1 Jan 1972 Jahr
-0.822
-0.066
8.75%
1 Jan 1973 Jahr
-0.931
-0.109
13.26%
1 Jan 1974 Jahr
-1.017
-0.087
9.3%
1 Jan 1975 Jahr
-1.099
-0.081
8.01%
1 Jan 1976 Jahr
-1.173
-0.074
6.77%
1 Jan 1977 Jahr
-1.238
-0.065
5.53%
1 Jan 1978 Jahr
-1.293
-0.055
4.46%
1 Jan 1979 Jahr
-1.342
-0.049
3.75%
1 Jan 1980 Jahr
-1.378
-0.036
2.67%
1 Jan 1981 Jahr
-1.408
-0.03
2.2%
1 Jan 1982 Jahr
-1.426
-0.018
1.26%
1 Jan 1983 Jahr
-1.021
+0.405
-28.39%
1 Jan 1984 Jahr
0.733
+1.753
-171.76%
1 Jan 1985 Jahr
0.759
+0.027
3.63%
1 Jan 1986 Jahr
0.801
+0.042
5.52%
1 Jan 1987 Jahr
0.846
+0.045
5.61%
1 Jan 1988 Jahr
0.882
+0.036
4.26%
1 Jan 1989 Jahr
0.901
+0.019
2.13%
1 Jan 1990 Jahr
0.891
-0.01
-1.09%
1 Jan 1991 Jahr
0.87
-0.021
-2.38%
1 Jan 1992 Jahr
0.845
-0.025
-2.87%
1 Jan 1993 Jahr
0.577
-0.268
-31.72%
1 Jan 1994 Jahr
-0.492
-1.069
-185.32%
1 Jan 1995 Jahr
-0.544
-0.052
10.49%
1 Jan 1996 Jahr
-0.6
-0.057
10.4%
1 Jan 1997 Jahr
-0.653
-0.052
8.72%
1 Jan 1998 Jahr
-0.709
-0.057
8.7%
1 Jan 1999 Jahr
-0.754
-0.045
6.33%
1 Jan 2000 Jahr
-0.805
-0.051
6.78%
1 Jan 2001 Jahr
-0.836
-0.031
3.86%
1 Jan 2002 Jahr
-0.872
-0.036
4.32%
1 Jan 2003 Jahr
-0.907
-0.035
4.0%
1 Jan 2004 Jahr
-0.892
+0.015
-1.67%
1 Jan 2005 Jahr
-0.885
+0.007
-0.8%
1 Jan 2006 Jahr
-0.872
+0.013
-1.48%
1 Jan 2007 Jahr
-0.847
+0.025
-2.86%
1 Jan 2008 Jahr
-0.826
+0.021
-2.47%
1 Jan 2009 Jahr
-0.808
+0.018
-2.21%
1 Jan 2010 Jahr
-0.775
+0.033
-4.03%
1 Jan 2011 Jahr
-0.738
+0.037
-4.82%
1 Jan 2012 Jahr
-0.715
+0.023
-3.14%
1 Jan 2013 Jahr
-0.682
+0.033
-4.6%
1 Jan 2014 Jahr
-0.659
+0.023
-3.37%
1 Jan 2015 Jahr
-0.629
+0.03
-4.56%
1 Jan 2016 Jahr
-0.609
+0.02
-3.11%
Bewertung der Länder gemäß mit laufender Statistik nach Jahren


Kommentare: