29
/pt/
pt
AIzaSyAYiBZKx7MnpbEhh9jyipgxe19OcubqV5w
April 1, 2024
99644
Cameroon
CMR
true
2
1
Children out of school, male (% of male primary school age)
2015,2013,1992,1991,1989,1981,1980,1979,1978,1977,1976,1975,1974,1973,1972
Download
Biblioteca de estatísticas globais →Cameroon →

Children out of school, male (% of male primary school age)

Estas estatísticas em outros países:
AfghanistanAlbaniaAlgeriaAngolaAntigua and BarbudaArab WorldArgentinaArmeniaArubaAustraliaAustriaAzerbaijanBahamas, TheBahrainBangladeshBarbadosBelarusBelgiumBelizeBeninBermudaBhutanBoliviaBosnia and HerzegovinaBotswanaBrazilBrunei DarussalamBulgariaBurkina FasoBurundiCabo VerdeCambodiaCameroonCanadaCaribbean small statesCentral African RepublicCentral Europe and the BalticsChadChileChinaColombiaComorosCongo, Dem. Rep.Congo, Rep.Costa RicaCote d'IvoireCroatiaCubaCyprusDenmarkDjiboutiDominicaDominican RepublicEarly-demographic dividendEast Asia & PacificEast Asia & Pacific (excluding high income)East Asia & Pacific (IDA & IBRD countries)EcuadorEgypt, Arab Rep.El SalvadorEquatorial GuineaEritreaEstoniaEthiopiaEuro areaEurope & Central AsiaEurope & Central Asia (excluding high income)Europe & Central Asia (IDA & IBRD countries)European UnionFijiFinlandFragile and conflict affected situationsFranceGabonGambia, TheGeorgiaGhanaGreeceGrenadaGuatemalaGuineaGuinea-BissauGuyanaHaitiHeavily indebted poor countries (HIPC)High incomeHondurasHong Kong SAR, ChinaHungaryIBRD onlyIcelandIDA & IBRD totalIDA blendIDA onlyIDA totalIndiaIndonesiaIran, Islamic Rep.IraqIrelandIsraelItalyJamaicaJapanJordanKazakhstanKenyaKiribatiKorea, Dem. People’s Rep.Korea, Rep.KuwaitKyrgyz RepublicLao PDRLate-demographic dividendLatin America & Caribbean Latin America & Caribbean (excluding high income)Latin America & the Caribbean (IDA & IBRD countries)LatviaLeast developed countries: UN classificationLebanonLesothoLiberiaLibyaLiechtensteinLithuaniaLow & middle incomeLow incomeLower middle incomeLuxembourgMacao SAR, ChinaMacedonia, FYRMadagascarMalawiMaldivesMaliMaltaMarshall IslandsMauritaniaMauritiusMexicoMicronesia, Fed. Sts.Middle East & North AfricaMiddle East & North Africa (excluding high income)Middle East & North Africa (IDA & IBRD countries)Middle incomeMoldovaMongoliaMontenegroMoroccoMozambiqueMyanmarNamibiaNauruNepalNetherlandsNew ZealandNicaraguaNigerNigeriaNorth AmericaNorwayOECD membersOmanOther small statesPacific island small statesPakistanPanamaPapua New GuineaParaguayPeruPhilippinesPolandPortugalPost-demographic dividendPre-demographic dividendPuerto RicoQatarRomaniaRussian FederationRwandaSamoaSan MarinoSao Tome and PrincipeSaudi ArabiaSenegalSerbiaSeychellesSierra LeoneSloveniaSmall statesSolomon IslandsSomaliaSouth AfricaSouth AsiaSouth Asia (IDA & IBRD)South SudanSpainSri LankaSt. Kitts and NevisSt. LuciaSt. Vincent and the GrenadinesSub-Saharan Africa Sub-Saharan Africa (excluding high income)Sub-Saharan Africa (IDA & IBRD countries)SudanSurinameSwazilandSwedenSwitzerlandSyrian Arab RepublicTajikistanTanzaniaThailandTimor-LesteTogoTongaTrinidad and TobagoTunisiaTurkeyTuvaluUgandaUkraineUnited Arab EmiratesUnited KingdomUnited StatesUpper middle incomeUruguayUzbekistanVanuatuVenezuela, RBWest Bank and GazaWorldYemen, Rep.ZambiaZimbabwe
Linha do tempo:
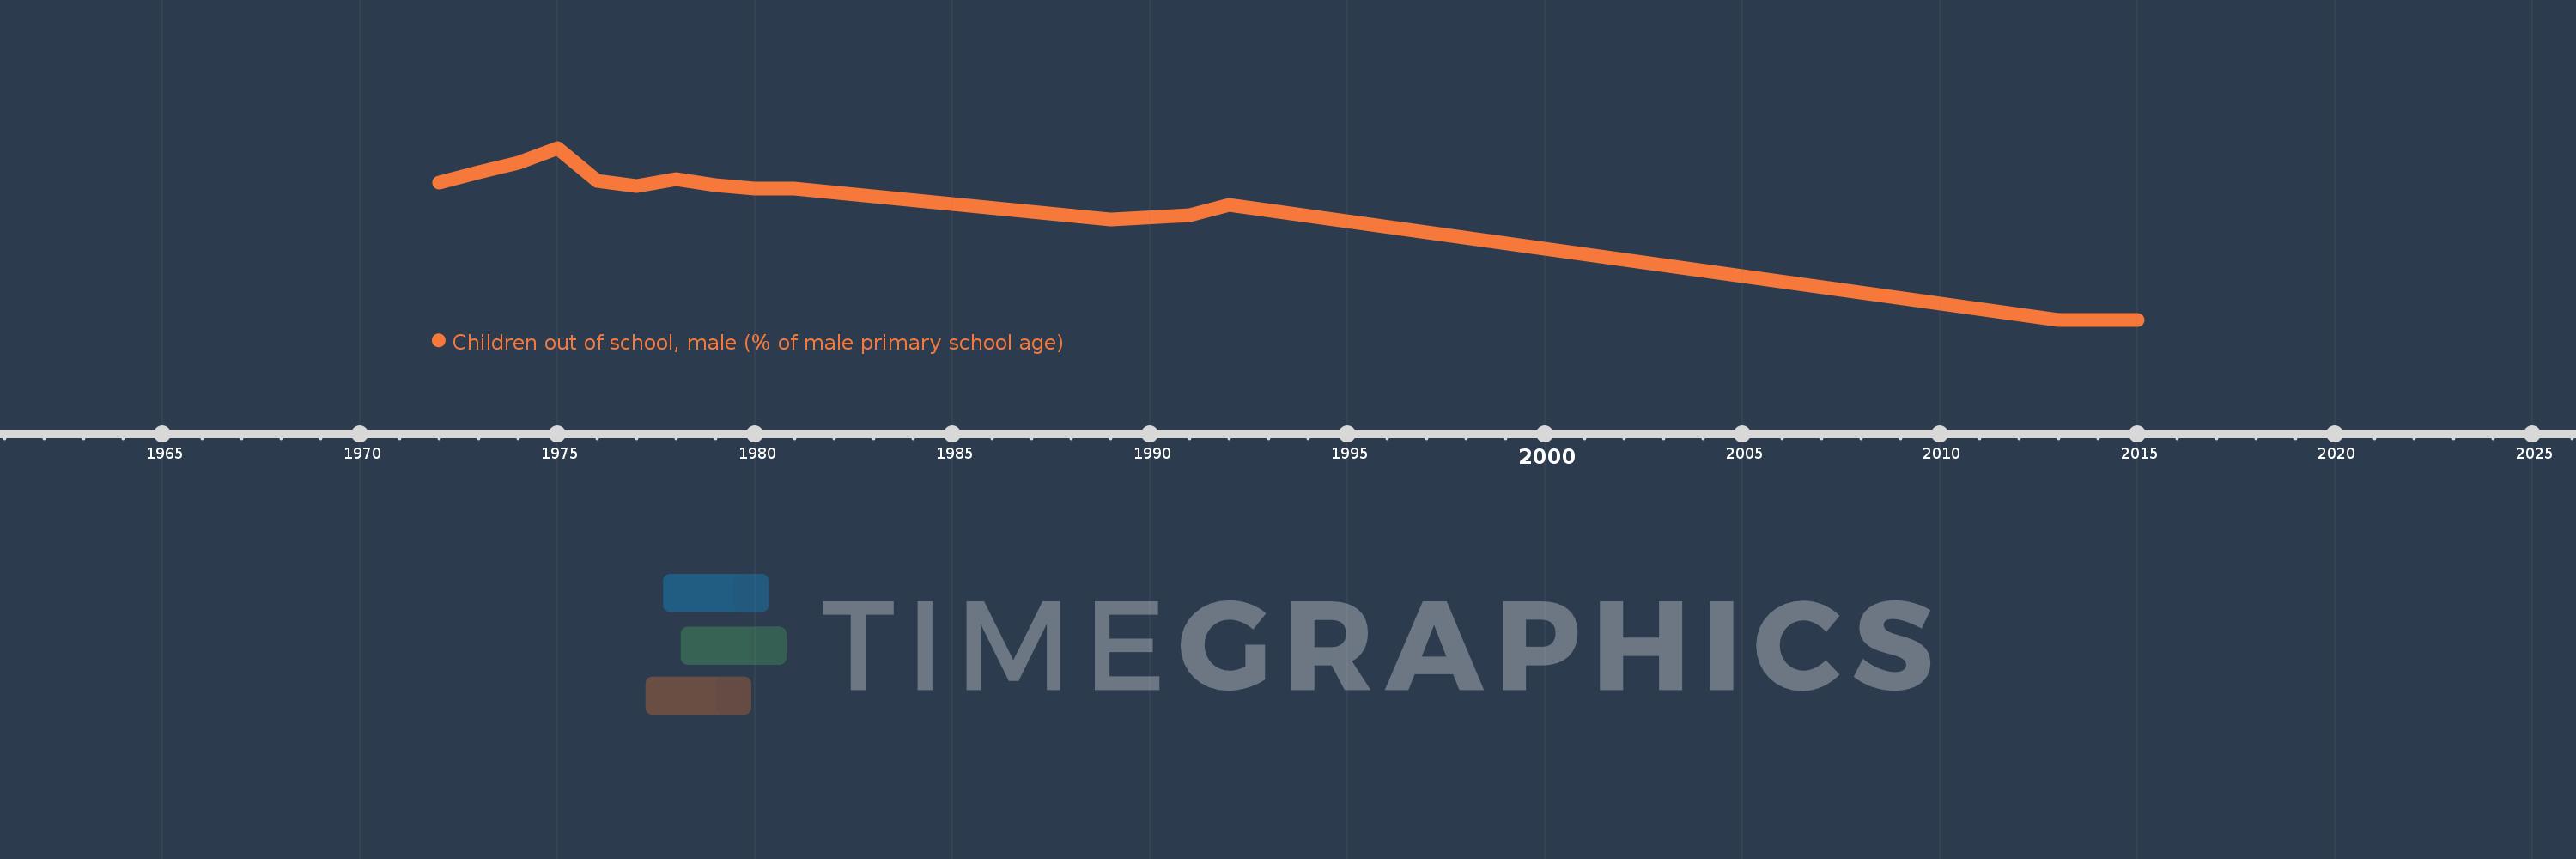
Nesta escala de tempo está apresentado um gráfico de 1972 ano até 2015 ano Cameroon. Dados de 1971 ano ausente. O número de observações reais por data: 15.
Fonte (nome):
Indicadores de desenvolvimento mundial
Fonte (organização):
United Nations Educational, Scientific, and Cultural Organization (UNESCO) Institute for Statistics.
Categorias:
Education
Foi atualizado:
23 abr 2017 ano
Indicadores de alterações dos valores ao longo dos anos
Em média:
25.49
Mínimo:
0.465
1 jan 2015 ano
Máximo:
37.461
1 jan 1975 ano
Na data de observação
Valor
Mudança absoluta
A alteração em relação ao valor anterior
1 jan 1972 ano
30.061
+30.061
0.0%
1 jan 1973 ano
32.282
+2.221
7.39%
1 jan 1974 ano
34.181
+1.899
5.88%
1 jan 1975 ano
37.461
+3.28
9.6%
1 jan 1976 ano
30.371
-7.09
-18.93%
1 jan 1977 ano
29.177
-1.194
-3.93%
1 jan 1978 ano
30.83
+1.653
5.66%
1 jan 1979 ano
29.36
-1.469
-4.77%
1 jan 1980 ano
28.72
-0.64
-2.18%
1 jan 1981 ano
28.619
-0.101
-0.35%
1 jan 1989 ano
22.092
-6.527
-22.81%
1 jan 1991 ano
23.06
+0.969
4.39%
1 jan 1992 ano
25.202
+2.142
9.29%
1 jan 2013 ano
0.47
-24.732
-98.13%
1 jan 2015 ano
0.465
-0.005
-1.12%
Classificação de países por estatísticas atuais por anos

Comentários:

Enviar
PremiumAbout & FeedbackAcordoPrivacidade
logo
© 2022 Selected Technologies LLC – Morgan Hill, California