33
/pt/
AIzaSyB4mHJ5NPEv-XzF7P6NDYXjlkCWaeKw5bc
November 1, 2025
258090
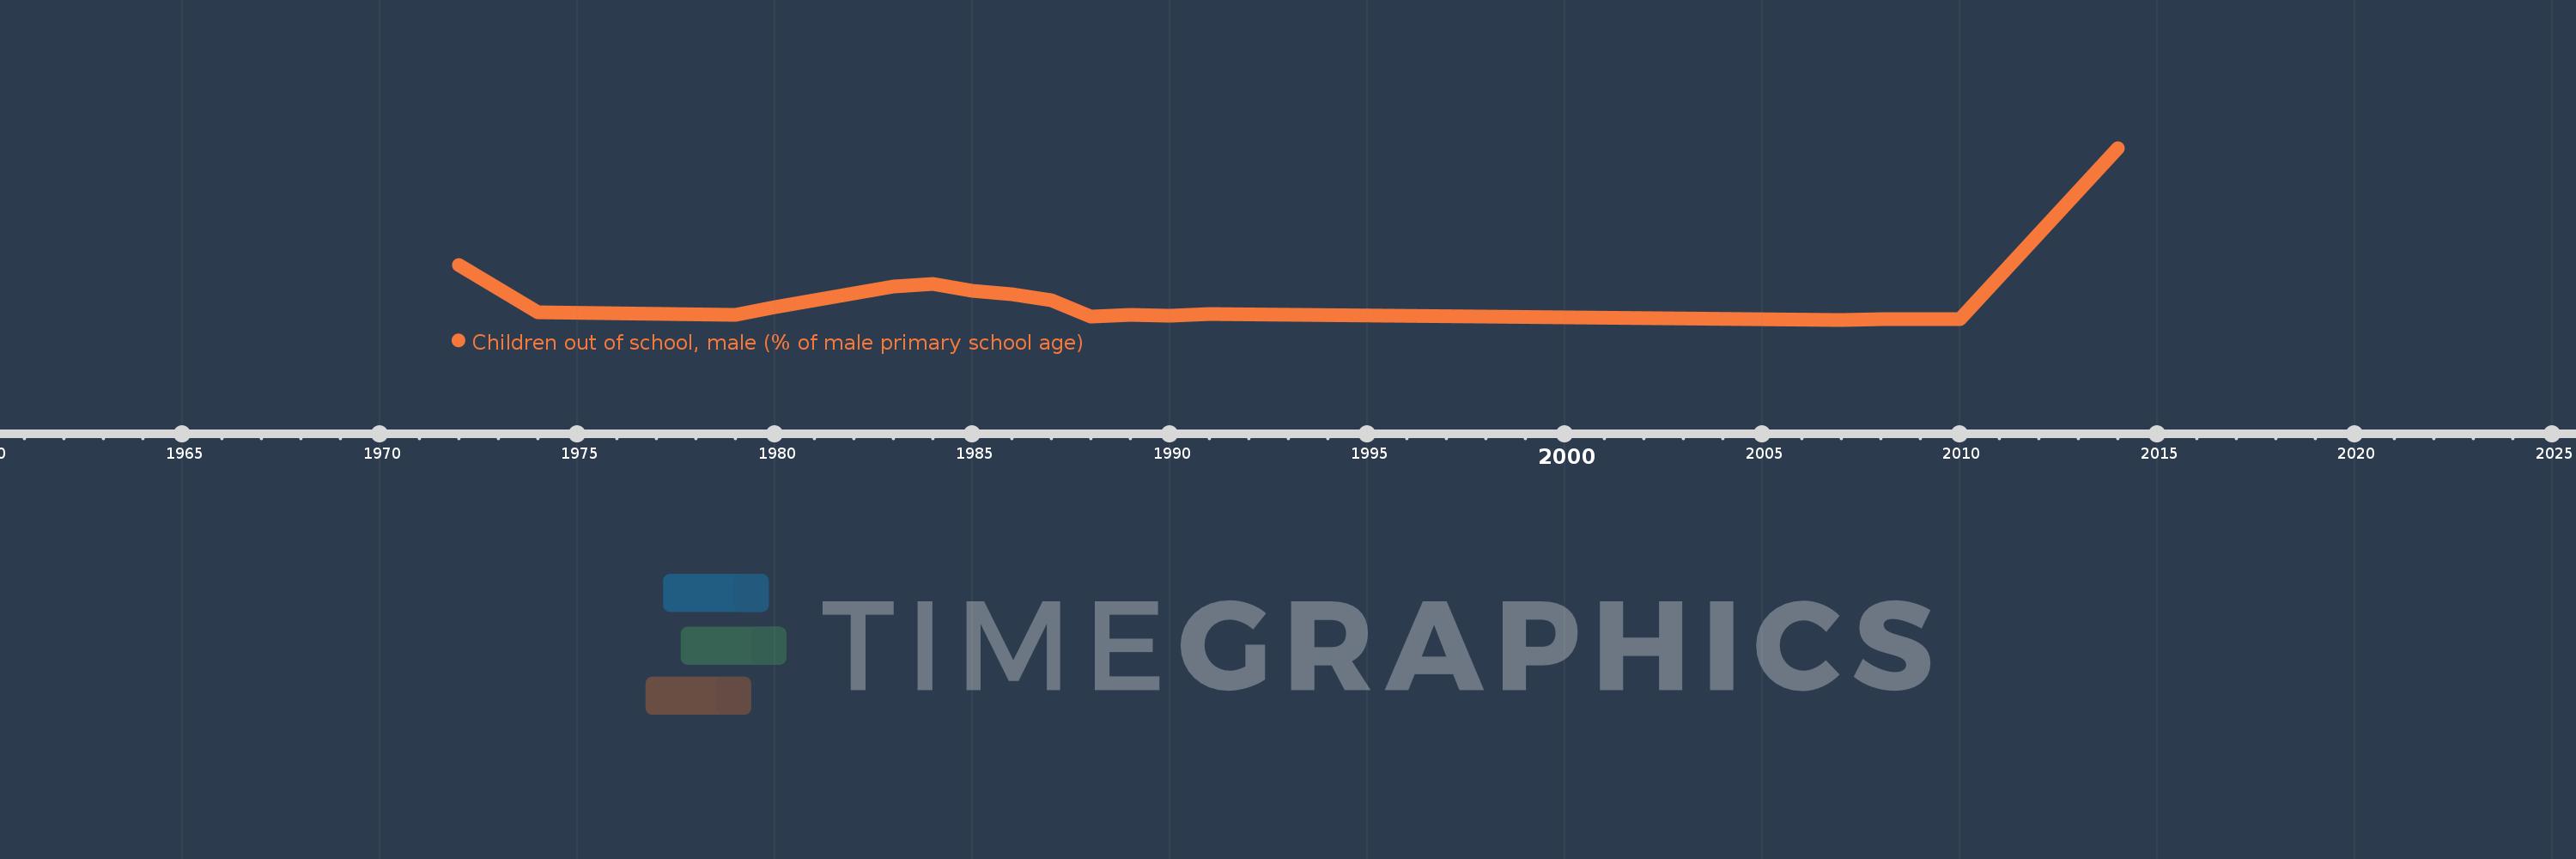
Syrian Arab Republic
SYR
true
2
1
Children out of school, male (% of male primary school age)
2014,2010,2009,2008,2007,1998,1991,1990,1989,1988,1987,1986,1985,1984,1983,1982,1981,1980,1979,1974,1972