33
/pt/
AIzaSyB4mHJ5NPEv-XzF7P6NDYXjlkCWaeKw5bc
November 1, 2025
96581
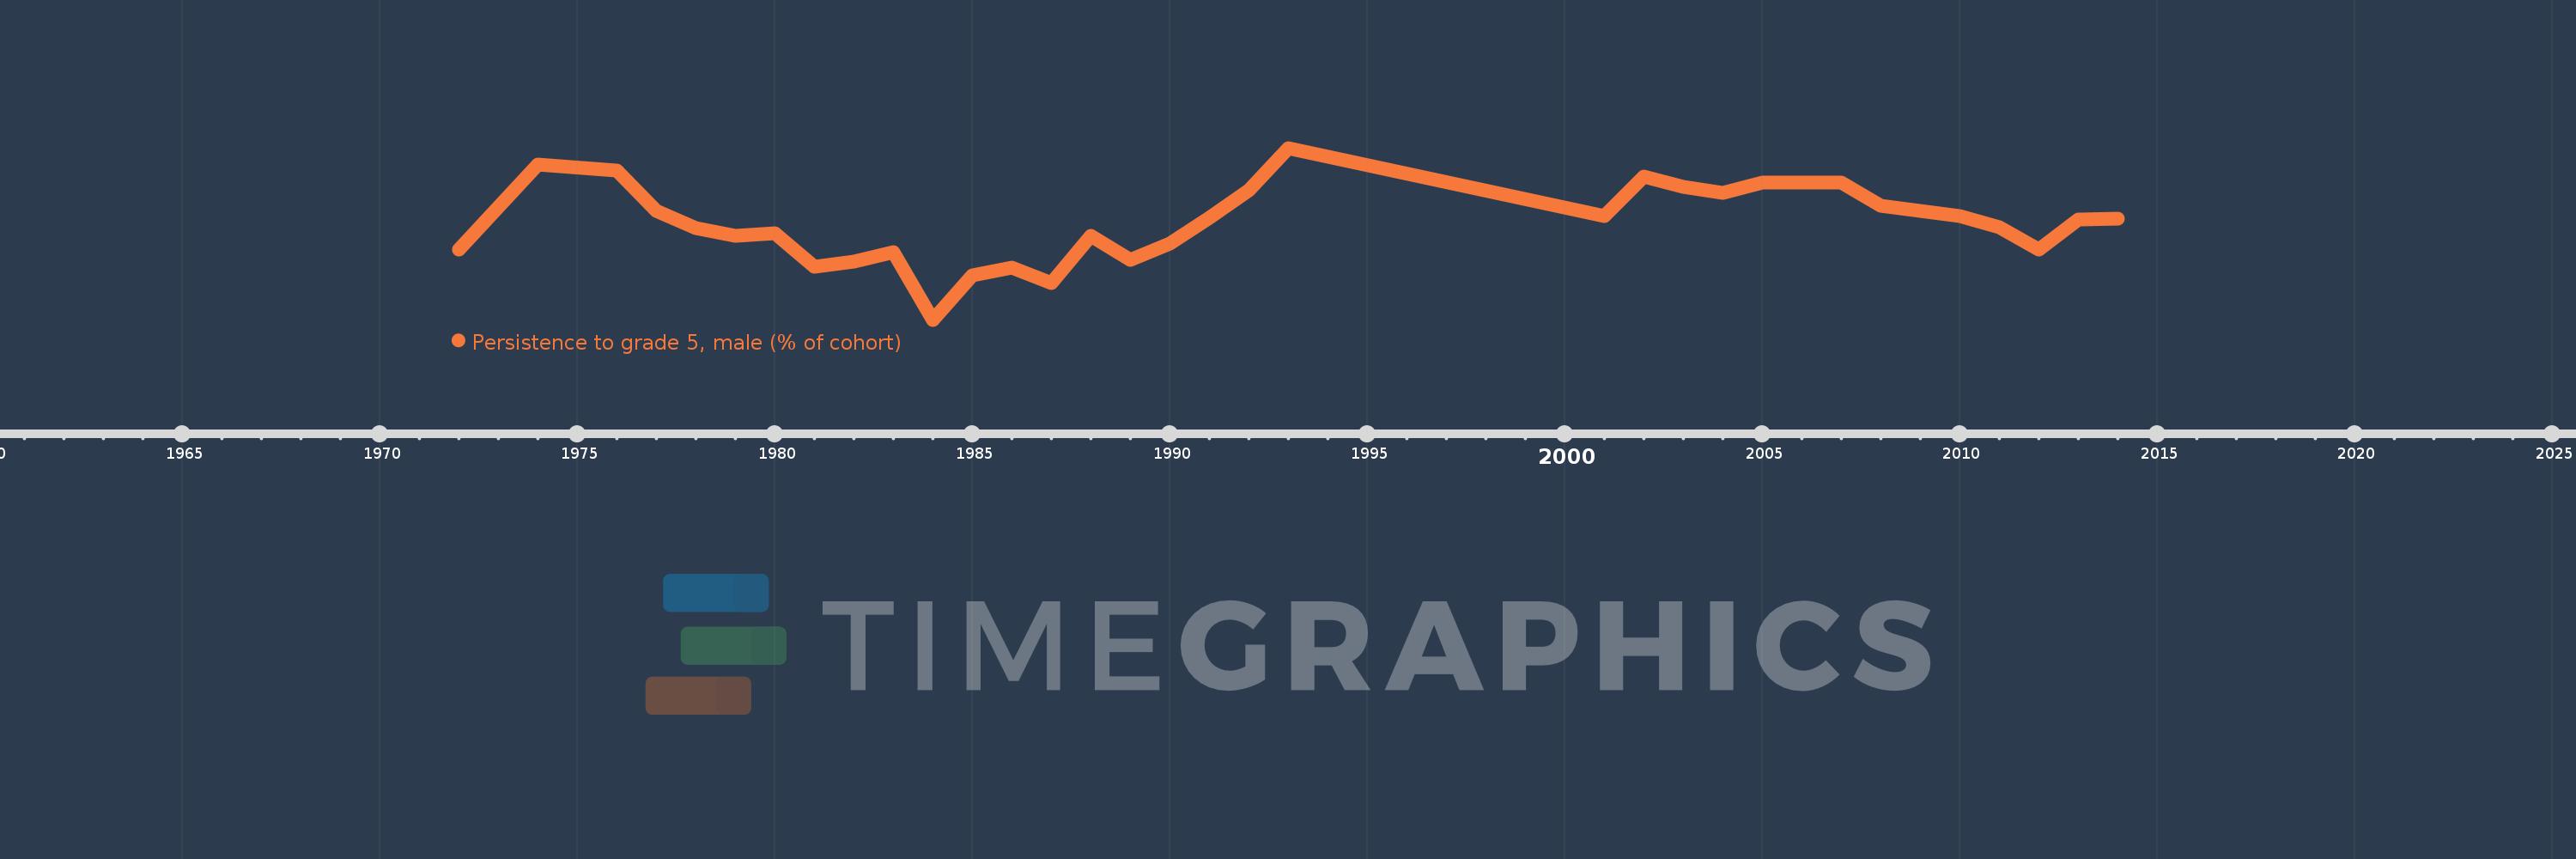
Burundi
BDI
true
2
1
Persistence to grade 5, male (% of cohort)
2014,2013,2012,2011,2010,2008,2007,2005,2004,2003,2002,2001,1993,1992,1991,1990,1989,1988,1987,1986,1985,1984,1983,1982,1981,1980,1979,1978,1977,1976,1974,1972