33
/pt/
AIzaSyB4mHJ5NPEv-XzF7P6NDYXjlkCWaeKw5bc
November 1, 2025
107745
Colombia
COL
true
2
1
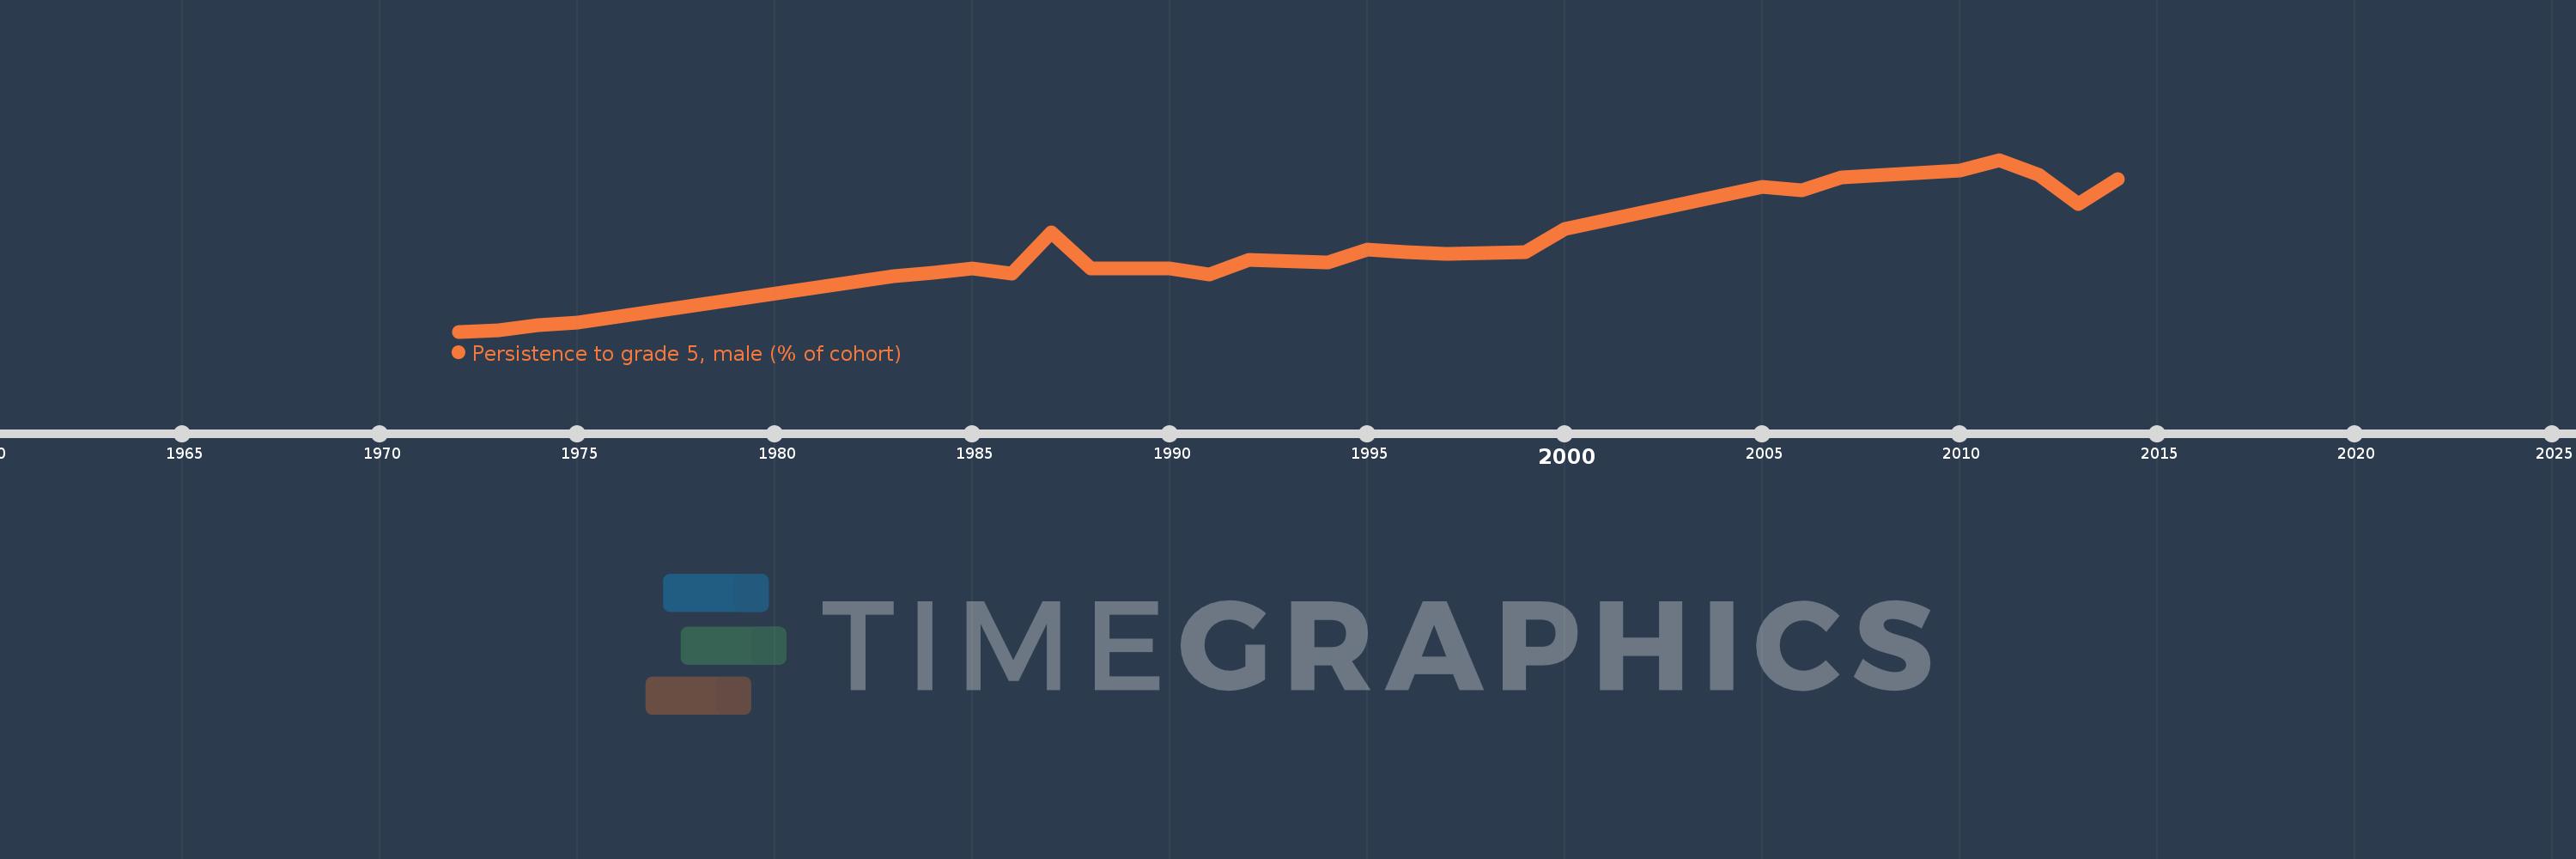
Persistence to grade 5, male (% of cohort)
2014,2013,2012,2011,2010,2007,2006,2005,2000,1999,1997,1996,1995,1994,1992,1991,1990,1989,1988,1987,1986,1985,1984,1983,1975,1974,1973,1972