33
/pt/
AIzaSyB4mHJ5NPEv-XzF7P6NDYXjlkCWaeKw5bc
November 30, 2025
95110
Burkina Faso
BFA
true
2
1
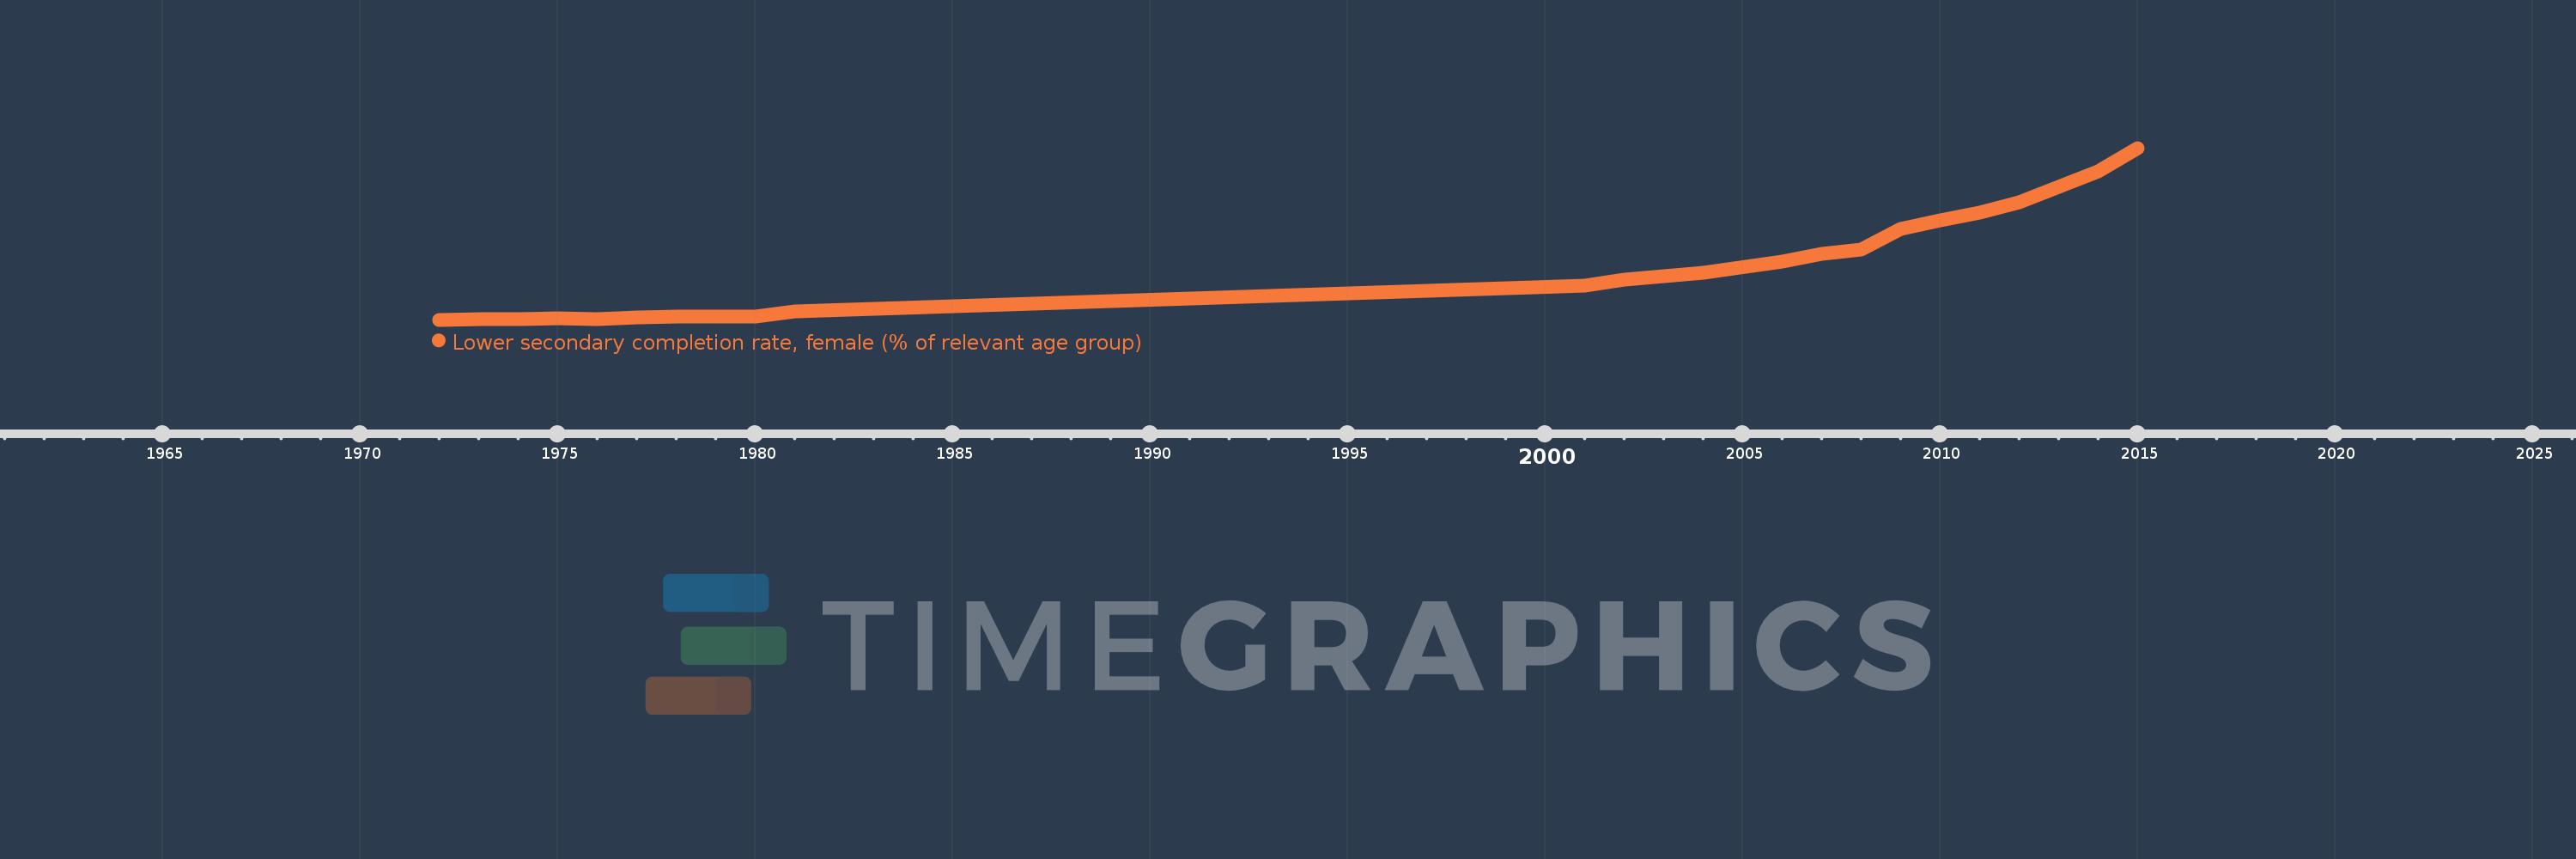
Lower secondary completion rate, female (% of relevant age group)
2015,2014,2013,2012,2011,2010,2009,2008,2007,2006,2004,2002,2001,1995,1981,1980,1978,1977,1976,1975,1974,1973,1972