29
/pt/
pt
AIzaSyAYiBZKx7MnpbEhh9jyipgxe19OcubqV5w
April 1, 2024
177897
Lesotho
LSO
true
2
1
Lower secondary completion rate, female (% of relevant age group)
2015,2014,2013,2011,2010,2009,2008,2007,2006,2005,2004,2003,2002,2001,2000,1999,1988,1987,1974,1973
Download
Biblioteca de estatísticas globais →Lesotho →

Lower secondary completion rate, female (% of relevant age group)

Estas estatísticas em outros países:
AfghanistanAlbaniaAlgeriaAngolaAntigua and BarbudaArab WorldArgentinaArmeniaArubaAustriaAzerbaijanBahamas, TheBahrainBangladeshBarbadosBelarusBelgiumBelizeBeninBermudaBhutanBoliviaBosnia and HerzegovinaBotswanaBrunei DarussalamBulgariaBurkina FasoBurundiCabo VerdeCambodiaCameroonCaribbean small statesCentral African RepublicCentral Europe and the BalticsChadChileChinaColombiaComorosCongo, Dem. Rep.Congo, Rep.Costa RicaCote d'IvoireCroatiaCubaCyprusCzech RepublicDenmarkDjiboutiDominicaDominican RepublicEarly-demographic dividendEast Asia & PacificEast Asia & Pacific (excluding high income)East Asia & Pacific (IDA & IBRD countries)EcuadorEgypt, Arab Rep.El SalvadorEquatorial GuineaEritreaEstoniaEthiopiaEuro areaEurope & Central AsiaEurope & Central Asia (excluding high income)Europe & Central Asia (IDA & IBRD countries)European UnionFijiFinlandFragile and conflict affected situationsFranceGabonGambia, TheGeorgiaGermanyGhanaGreeceGrenadaGuatemalaGuineaGuinea-BissauGuyanaHaitiHeavily indebted poor countries (HIPC)High incomeHondurasHong Kong SAR, ChinaHungaryIBRD onlyIcelandIDA & IBRD totalIDA blendIDA onlyIDA totalIndiaIndonesiaIran, Islamic Rep.IraqIrelandIsraelItalyJamaicaJapanJordanKazakhstanKenyaKiribatiKorea, Dem. People’s Rep.Korea, Rep.KuwaitKyrgyz RepublicLao PDRLate-demographic dividendLatin America & Caribbean Latin America & Caribbean (excluding high income)Latin America & the Caribbean (IDA & IBRD countries)LatviaLeast developed countries: UN classificationLebanonLesothoLiberiaLiechtensteinLithuaniaLow & middle incomeLow incomeLower middle incomeLuxembourgMacao SAR, ChinaMacedonia, FYRMadagascarMalawiMaldivesMaliMaltaMarshall IslandsMauritaniaMauritiusMexicoMiddle East & North AfricaMiddle East & North Africa (excluding high income)Middle East & North Africa (IDA & IBRD countries)Middle incomeMoldovaMongoliaMontenegroMoroccoMozambiqueMyanmarNamibiaNauruNepalNetherlandsNicaraguaNigerNorwayOECD membersOmanOther small statesPacific island small statesPakistanPalauPanamaPapua New GuineaParaguayPeruPhilippinesPolandPortugalPost-demographic dividendPre-demographic dividendQatarRomaniaRussian FederationRwandaSamoaSan MarinoSao Tome and PrincipeSaudi ArabiaSenegalSerbiaSeychellesSierra LeoneSlovak RepublicSloveniaSmall statesSolomon IslandsSouth AfricaSouth AsiaSouth Asia (IDA & IBRD)South SudanSpainSri LankaSt. Kitts and NevisSt. LuciaSt. Vincent and the GrenadinesSub-Saharan Africa Sub-Saharan Africa (excluding high income)Sub-Saharan Africa (IDA & IBRD countries)SudanSurinameSwazilandSwedenSwitzerlandSyrian Arab RepublicTajikistanTanzaniaThailandTimor-LesteTogoTongaTrinidad and TobagoTunisiaTurkeyTuvaluUgandaUkraineUnited Arab EmiratesUpper middle incomeUruguayUzbekistanVanuatuVenezuela, RBVietnamWest Bank and GazaWorldYemen, Rep.ZambiaZimbabwe
Linha do tempo:
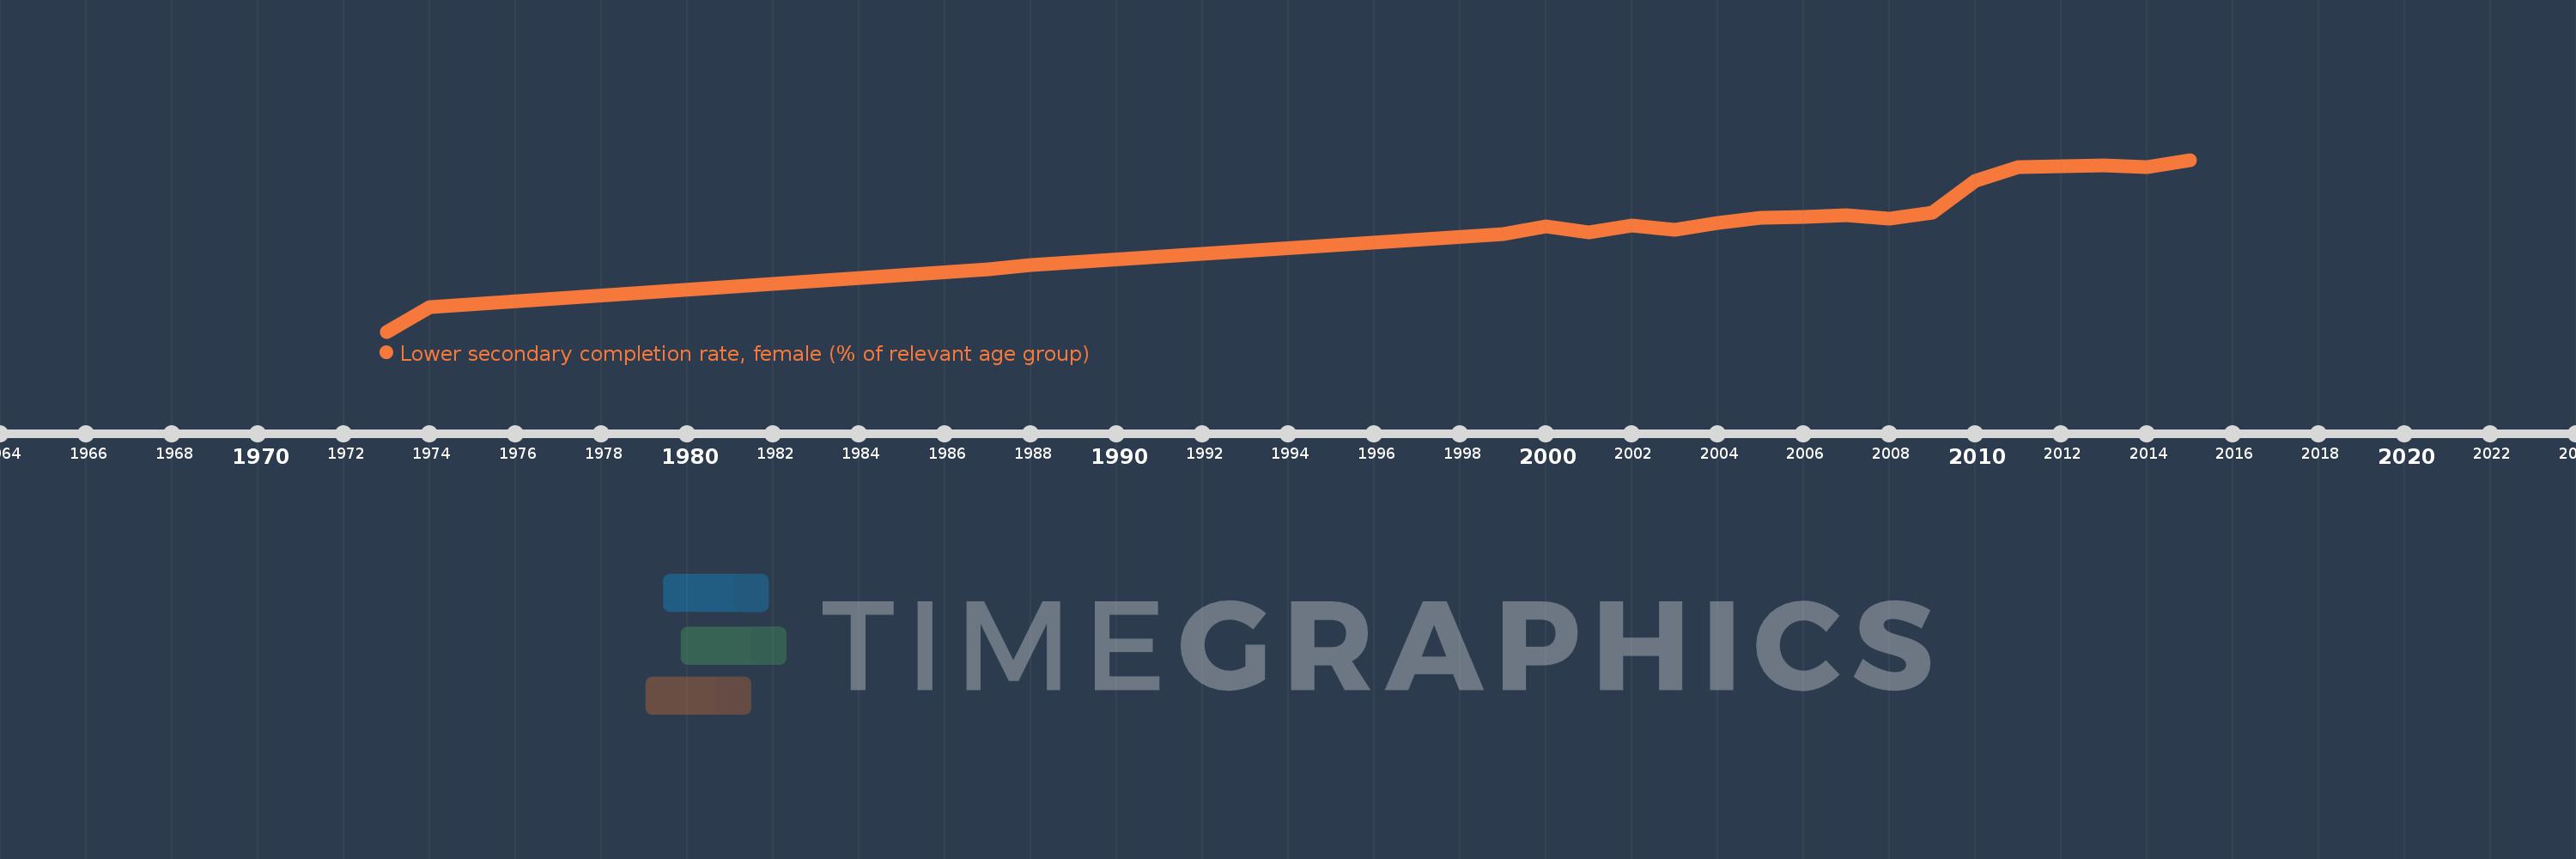
Nesta escala de tempo está apresentado um gráfico de 1973 ano até 2015 ano Lesotho. Dados de 1972 ano ausente. O número de observações reais por data: 20.
Fonte (nome):
Indicadores de desenvolvimento mundial
Fonte (organização):
United Nations Educational, Scientific, and Cultural Organization (UNESCO) Institute for Statistics.
Categorias:
Education
Foi atualizado:
23 abr 2017 ano
Indicadores de alterações dos valores ao longo dos anos
Em média:
33.957
Mínimo:
6.785
1 jan 1973 ano
Máximo:
49.92
1 jan 2015 ano
Na data de observação
Valor
Mudança absoluta
A alteração em relação ao valor anterior
1 jan 1973 ano
6.785
+6.785
0.0%
1 jan 1974 ano
12.922
+6.137
90.45%
1 jan 1987 ano
22.351
+9.429
72.97%
1 jan 1988 ano
23.445
+1.094
4.9%
1 jan 1999 ano
31.347
+7.903
33.71%
1 jan 2000 ano
33.099
+1.751
5.59%
1 jan 2001 ano
31.786
-1.313
-3.97%
1 jan 2002 ano
33.339
+1.554
4.89%
1 jan 2003 ano
32.328
-1.011
-3.03%
1 jan 2004 ano
33.972
+1.644
5.09%
1 jan 2005 ano
35.323
+1.35
3.98%
1 jan 2006 ano
35.478
+0.156
0.44%
1 jan 2007 ano
35.925
+0.447
1.26%
1 jan 2008 ano
35.047
-0.878
-2.44%
1 jan 2009 ano
36.637
+1.59
4.54%
1 jan 2010 ano
44.63
+7.993
21.82%
1 jan 2011 ano
48.049
+3.42
7.66%
1 jan 2013 ano
48.579
+0.53
1.1%
1 jan 2014 ano
48.184
-0.396
-0.81%
1 jan 2015 ano
49.92
+1.736
3.6%
Classificação de países por estatísticas atuais por anos

Comentários:

Enviar
PremiumAbout & FeedbackAcordoPrivacidade
logo
© 2022 Selected Technologies LLC – Morgan Hill, California