33
/pt/
AIzaSyB4mHJ5NPEv-XzF7P6NDYXjlkCWaeKw5bc
November 1, 2025
92961
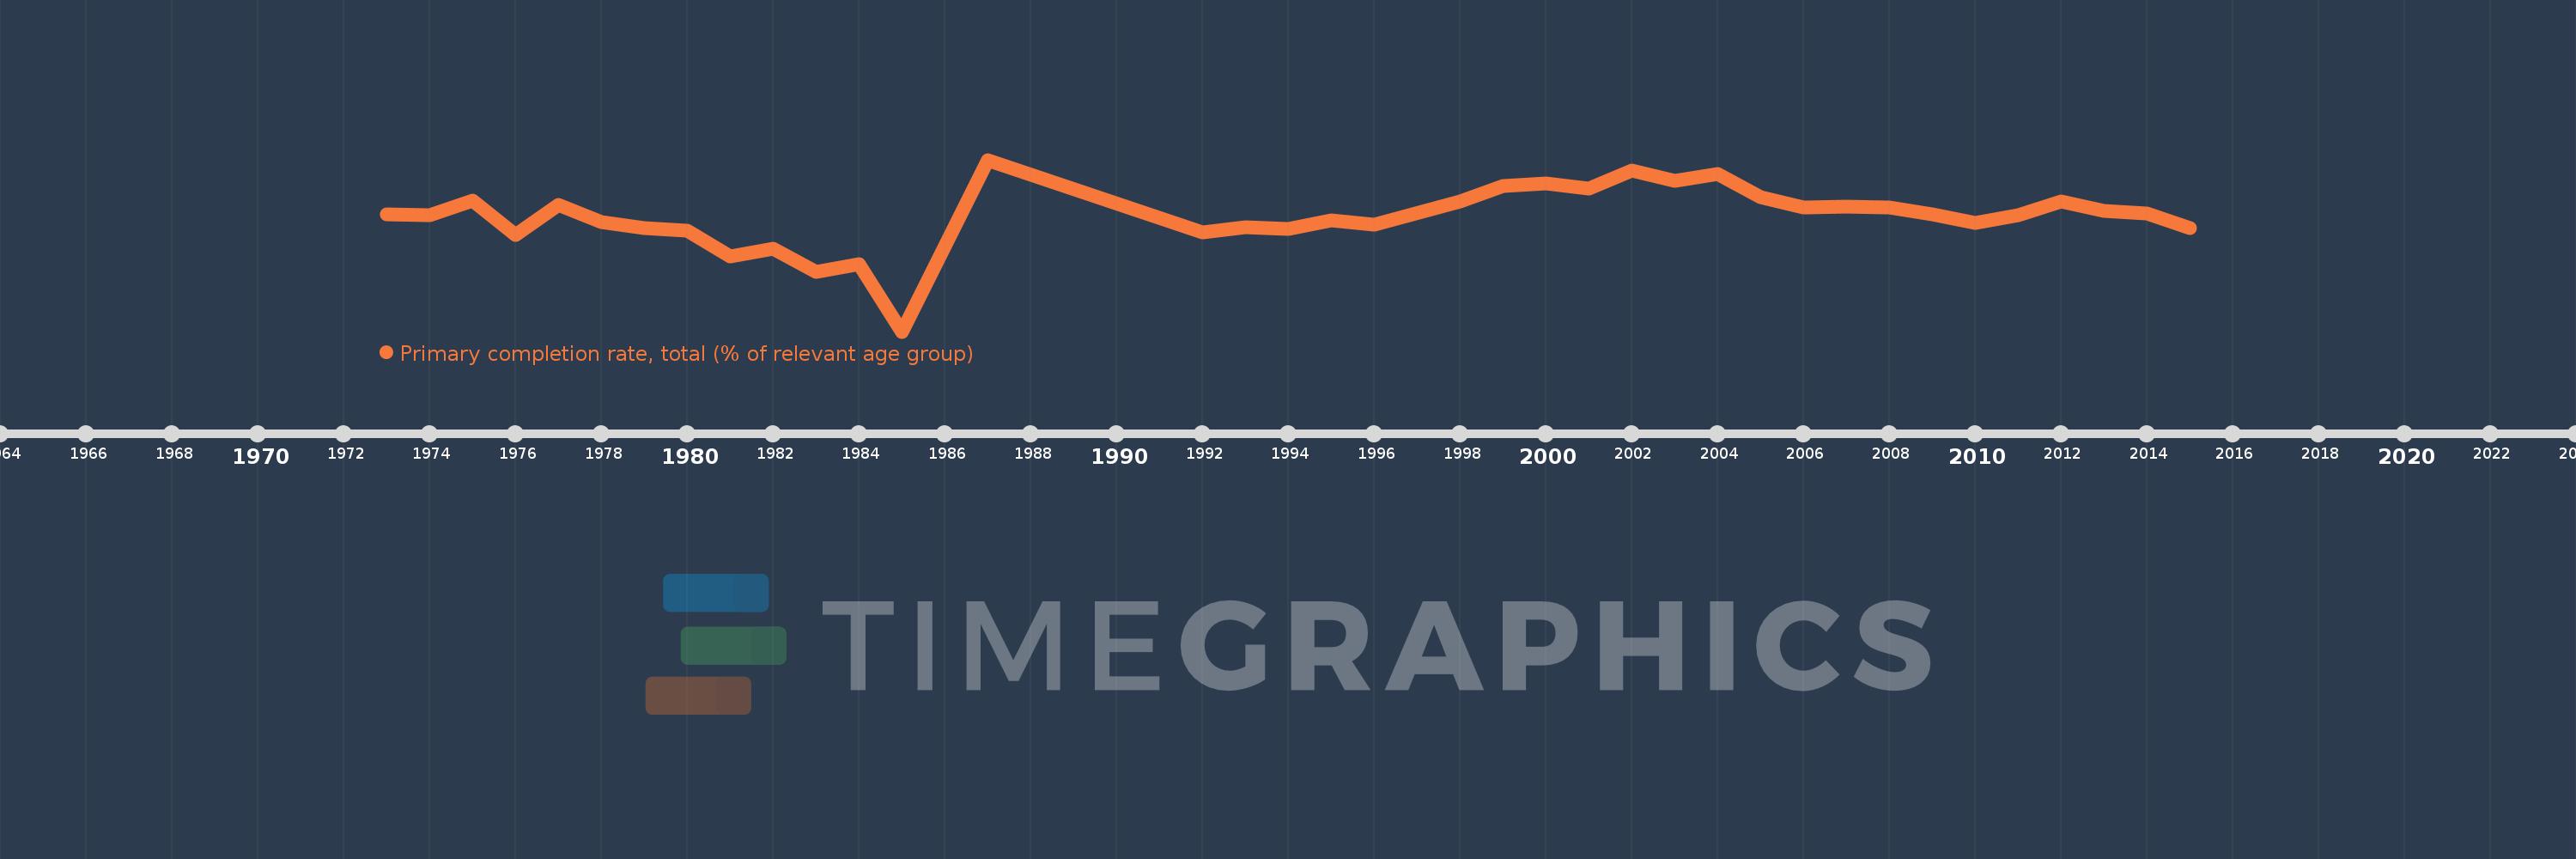
Brunei Darussalam
BRN
true
2
1
Primary completion rate, total (% of relevant age group)
2015,2014,2013,2012,2011,2010,2009,2008,2007,2006,2005,2004,2003,2002,2001,2000,1999,1998,1996,1995,1994,1993,1992,1987,1985,1984,1983,1982,1981,1980,1979,1978,1977,1976,1975,1974,1973