33
/pt/
AIzaSyB4mHJ5NPEv-XzF7P6NDYXjlkCWaeKw5bc
November 1, 2025
120393
Djibouti
DJI
true
2
1
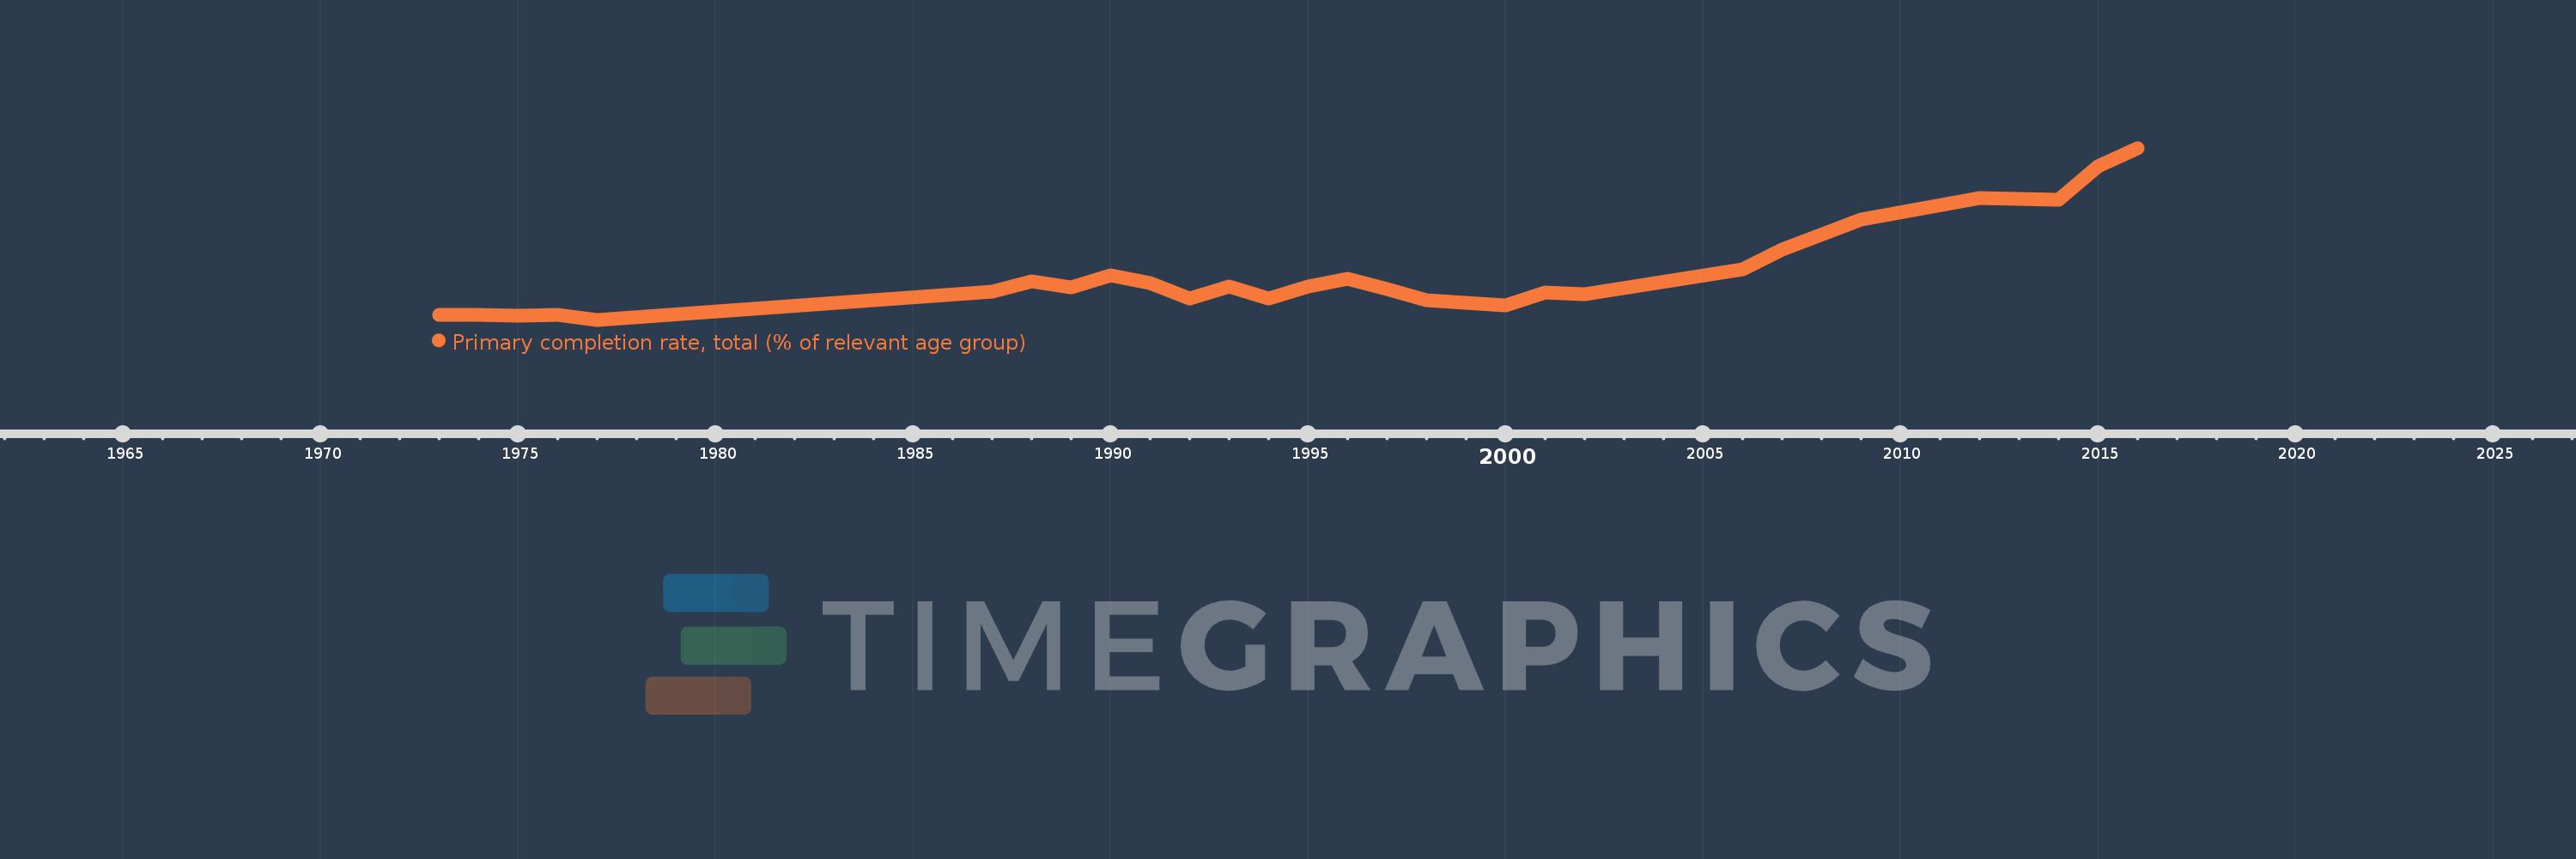
Primary completion rate, total (% of relevant age group)
2016,2015,2014,2012,2009,2007,2006,2002,2001,2000,1998,1997,1996,1995,1994,1993,1992,1991,1990,1989,1988,1987,1977,1976,1975,1974,1973